
Grain of Salt SF

Educational Library

A teaching collection organized around the four layers of Bitcoin treasury analysis.

31 original images · Collected

Figures retain their own dates and assumptions, including historical and conceptual references. The collection date is not an update date for every graphic; numerical content has not been freshly audited. Educational scenarios are not price forecasts.

Framework

2 images
01

The Four Layers of Bitcoin Treasury Analysis
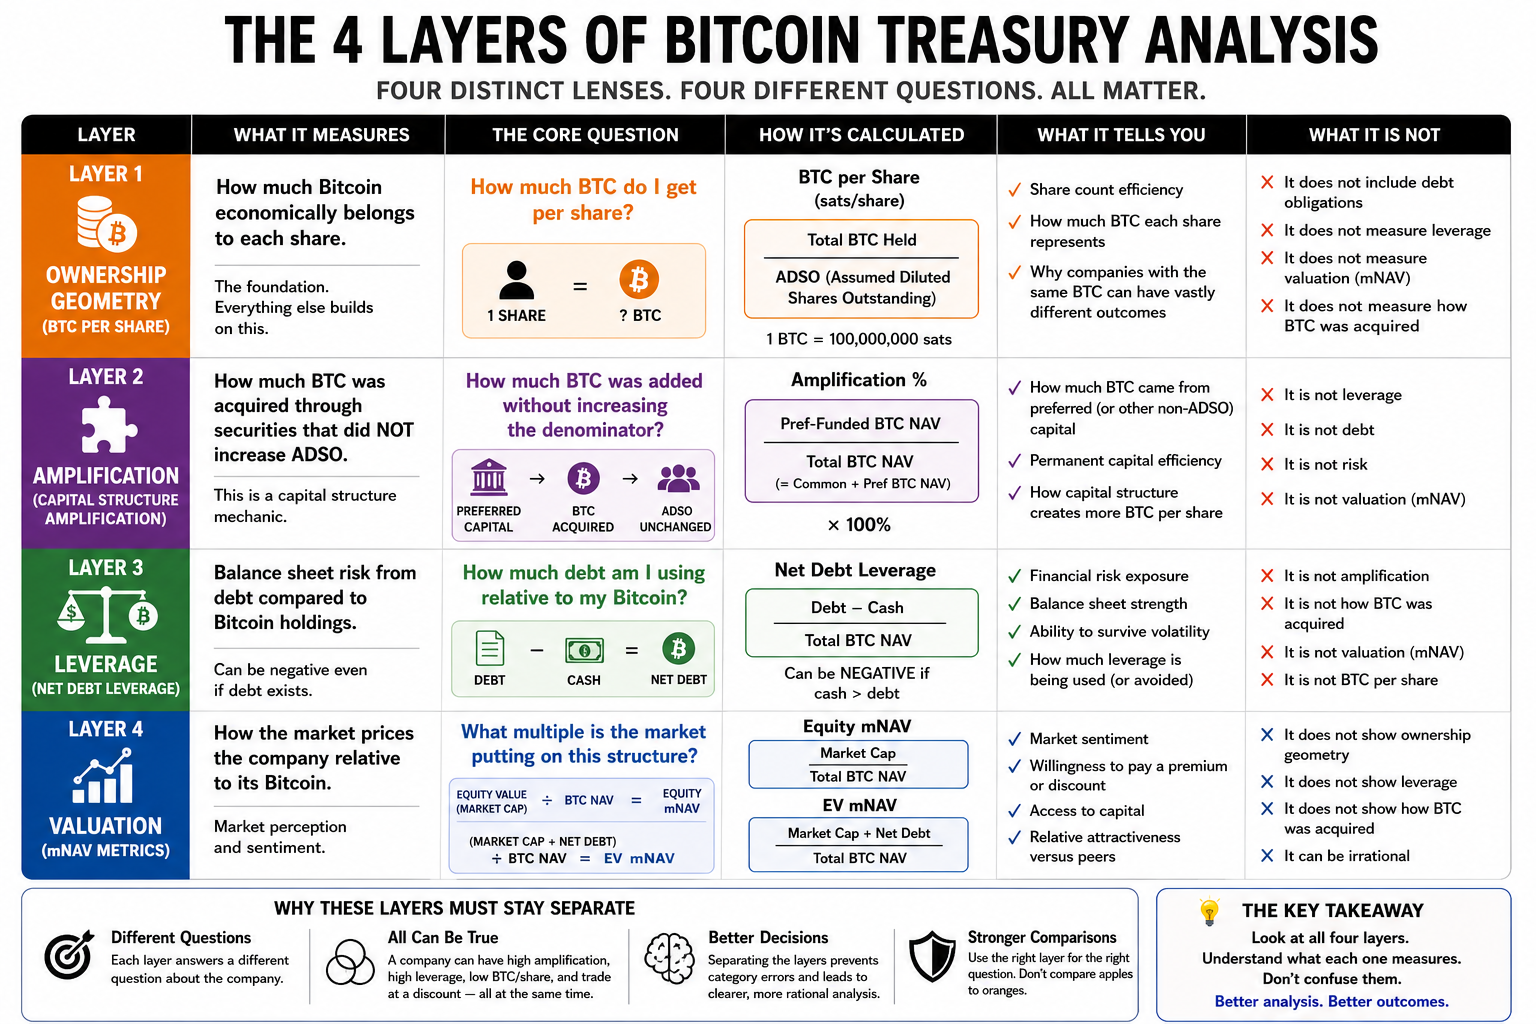
The Four Layers of Bitcoin Treasury Analysis
02

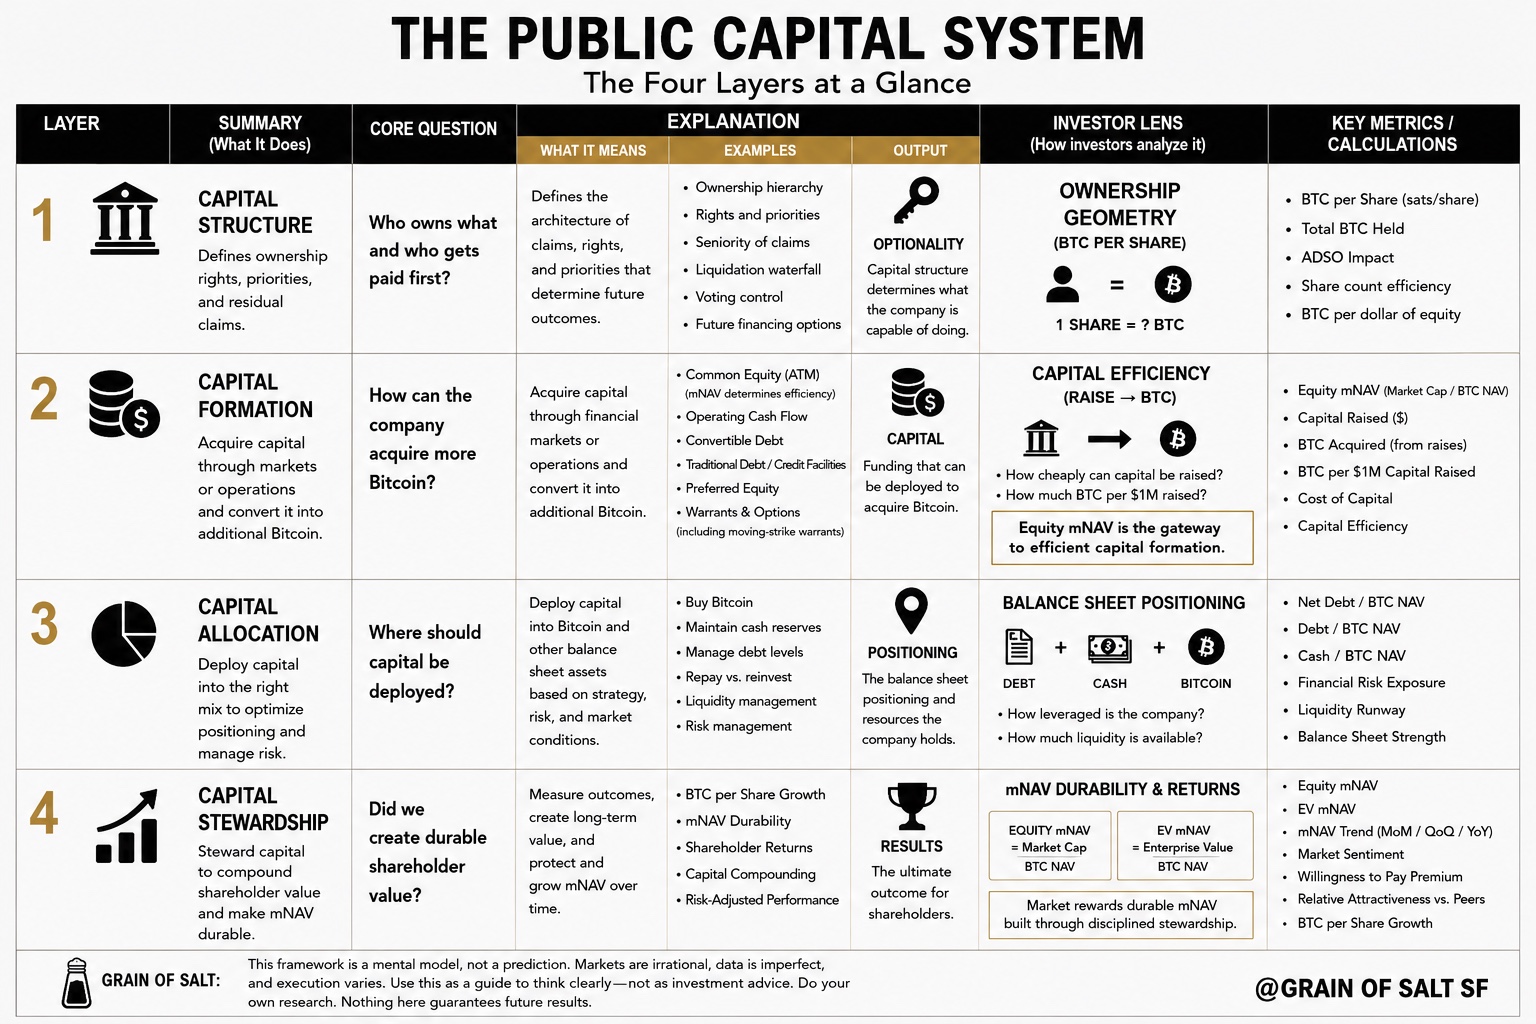
The Public Capital System

The Public Capital System

01 Ownership

4 images
03

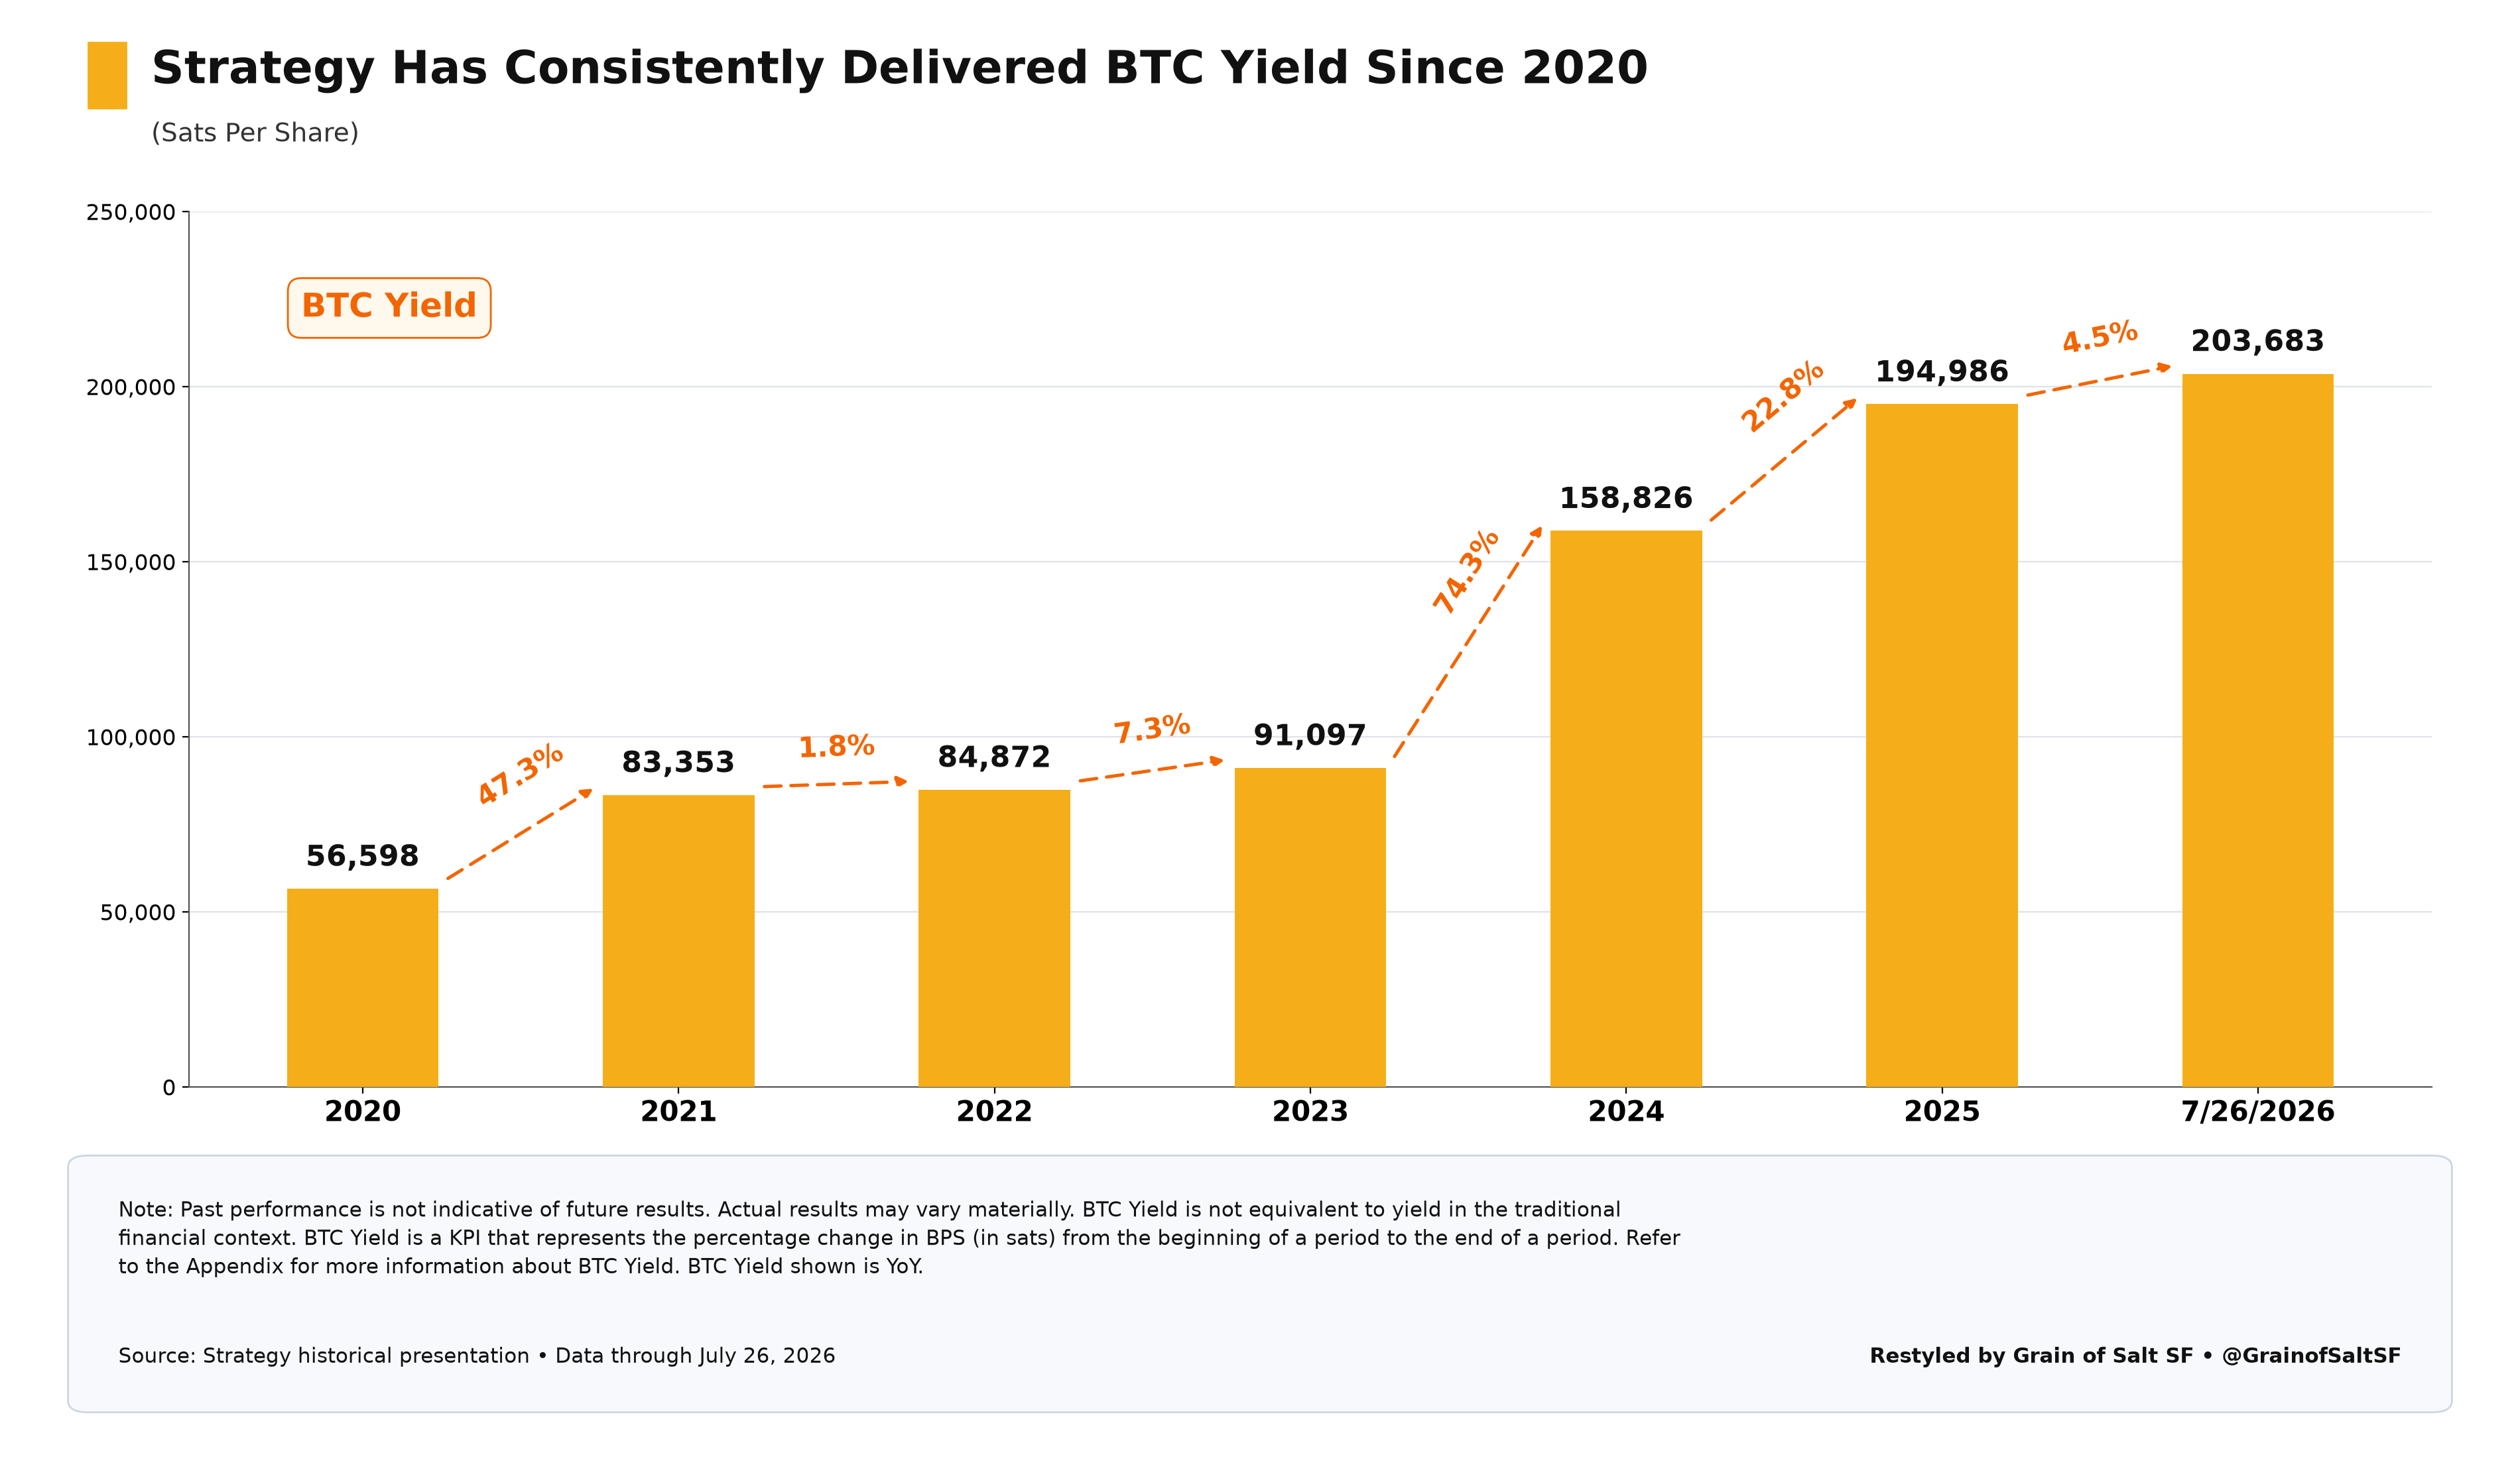
Strategy: Growth in Bitcoin per Share

White-background Strategy BTC yield bar chart: sats per share increase from 56,598 in 2020 to 203,683 on July 26, 2026, with annual BTC yield annotations; historical data through July 26, 2026.
04

Bitcoin per Share History — Corrected v2

v2
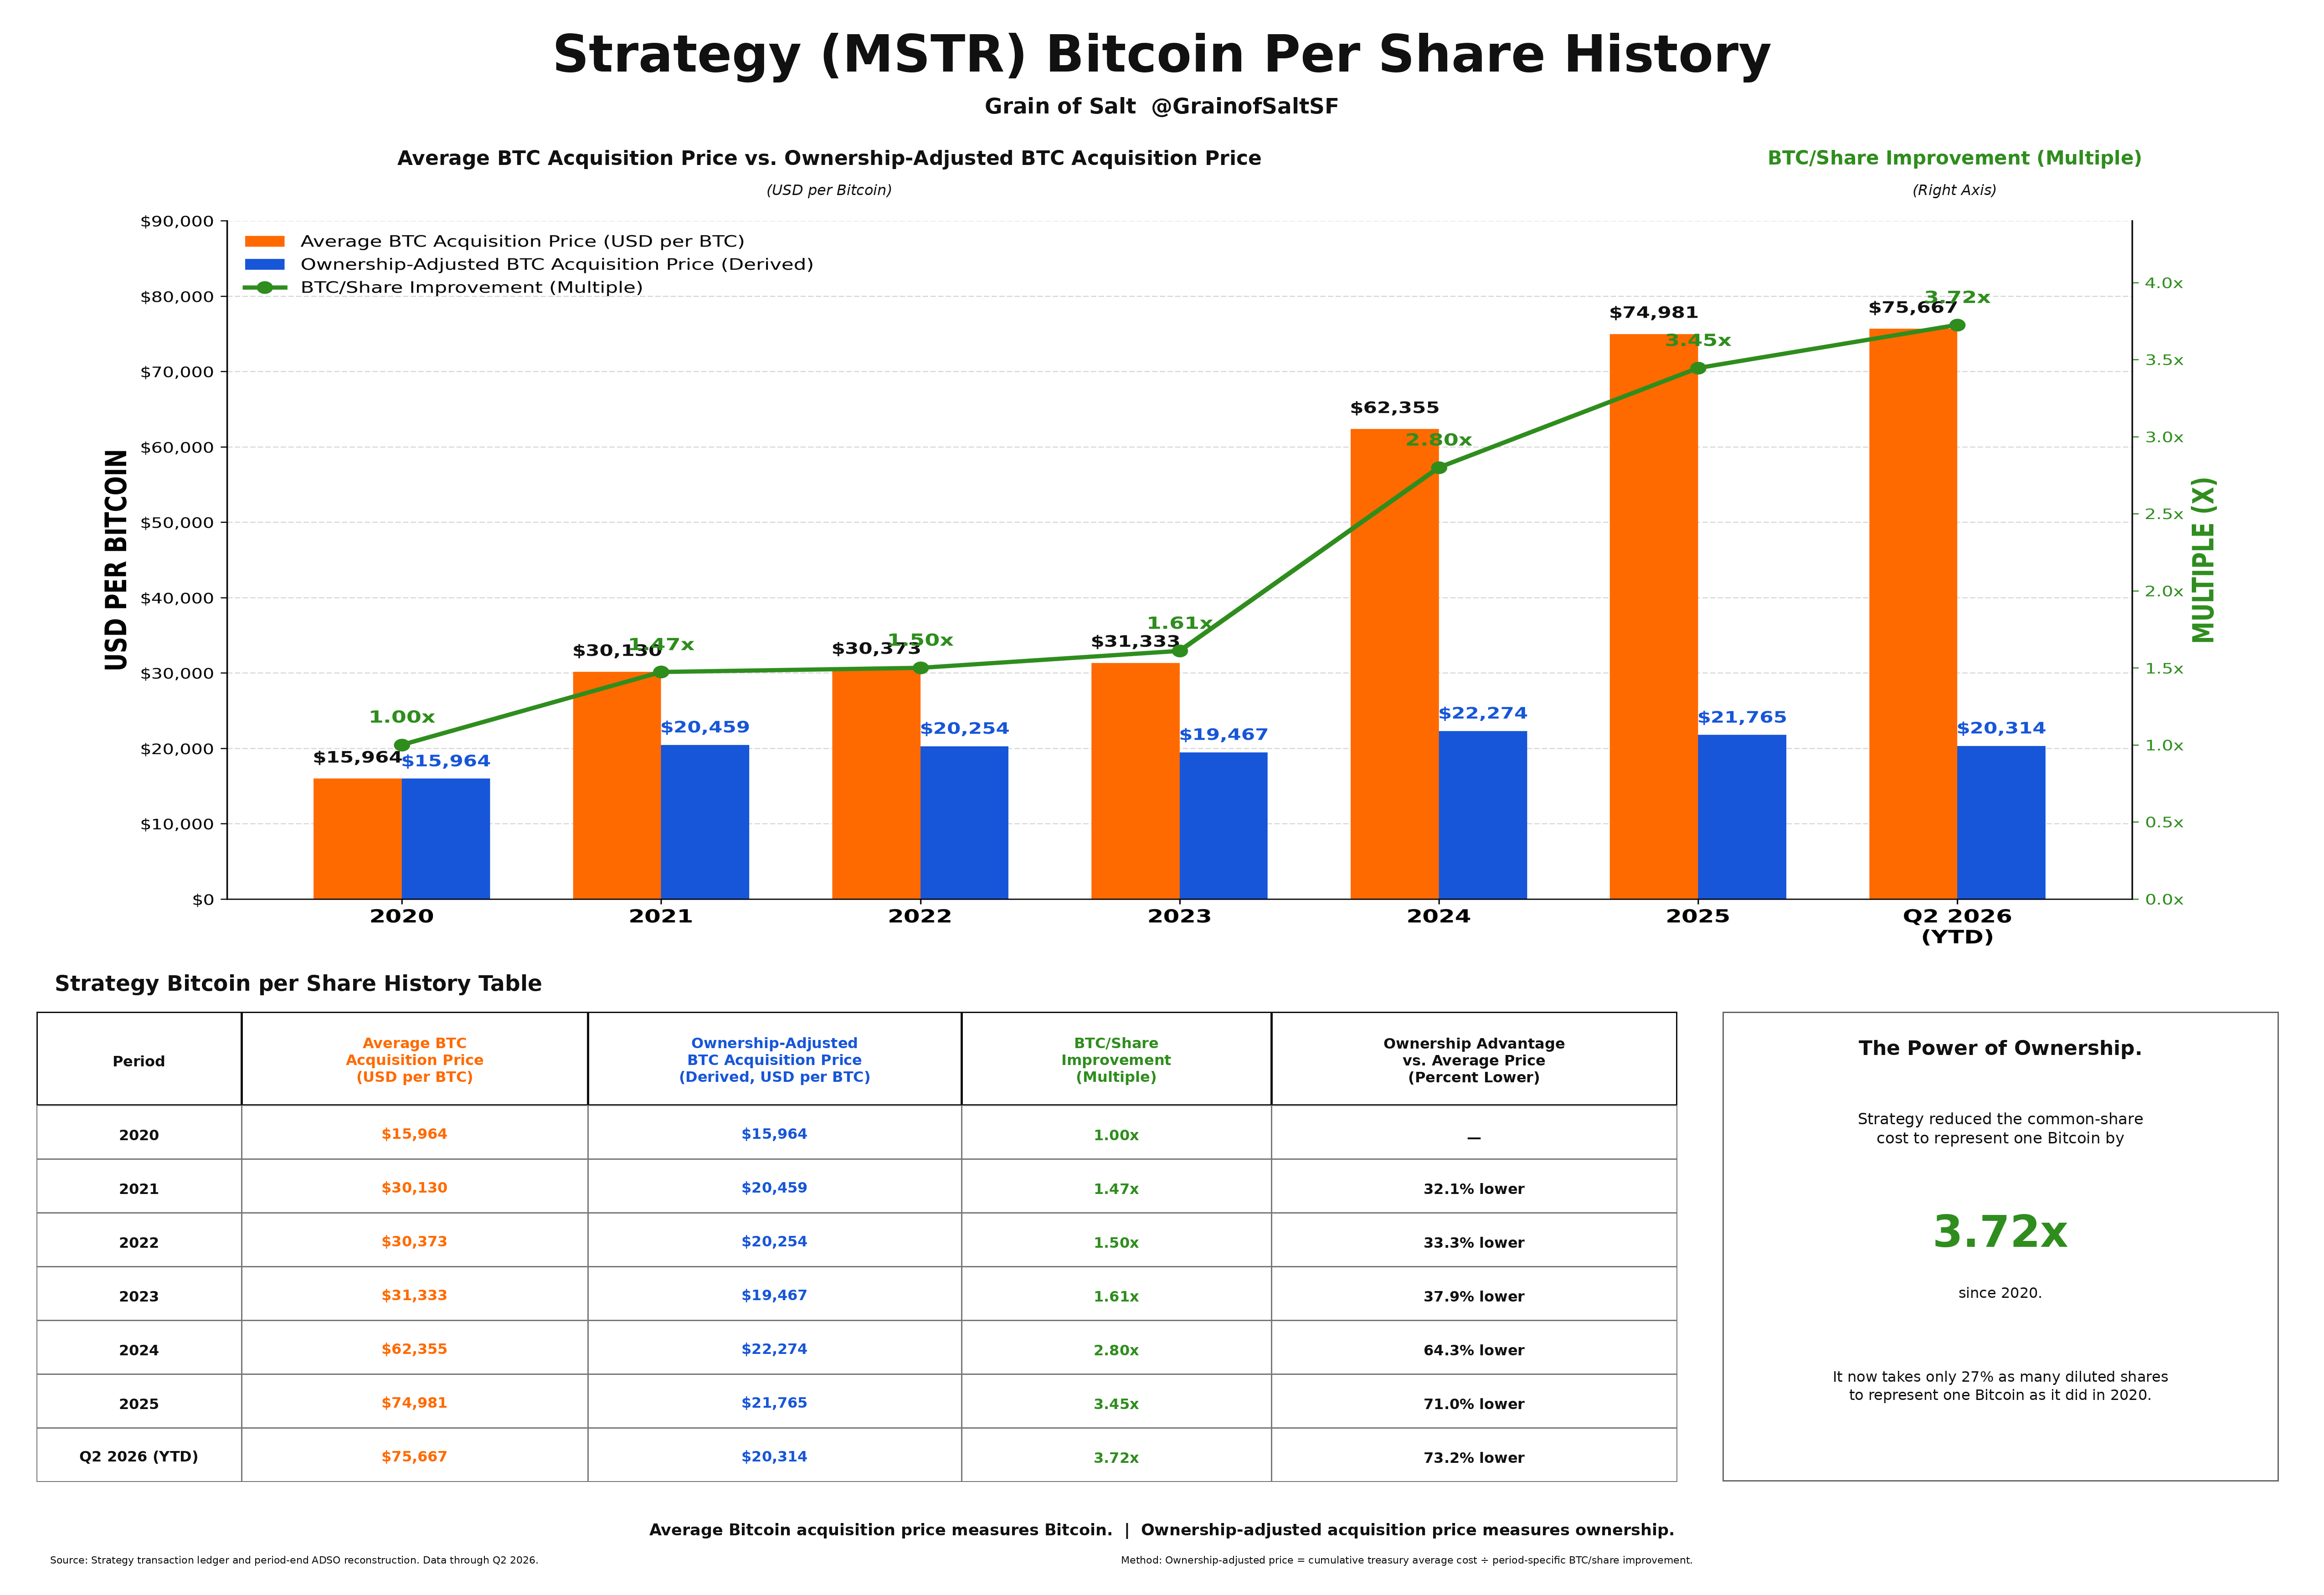
Bitcoin per Share History — Corrected v2
05

Bitcoin per Share and Shares per Bitcoin
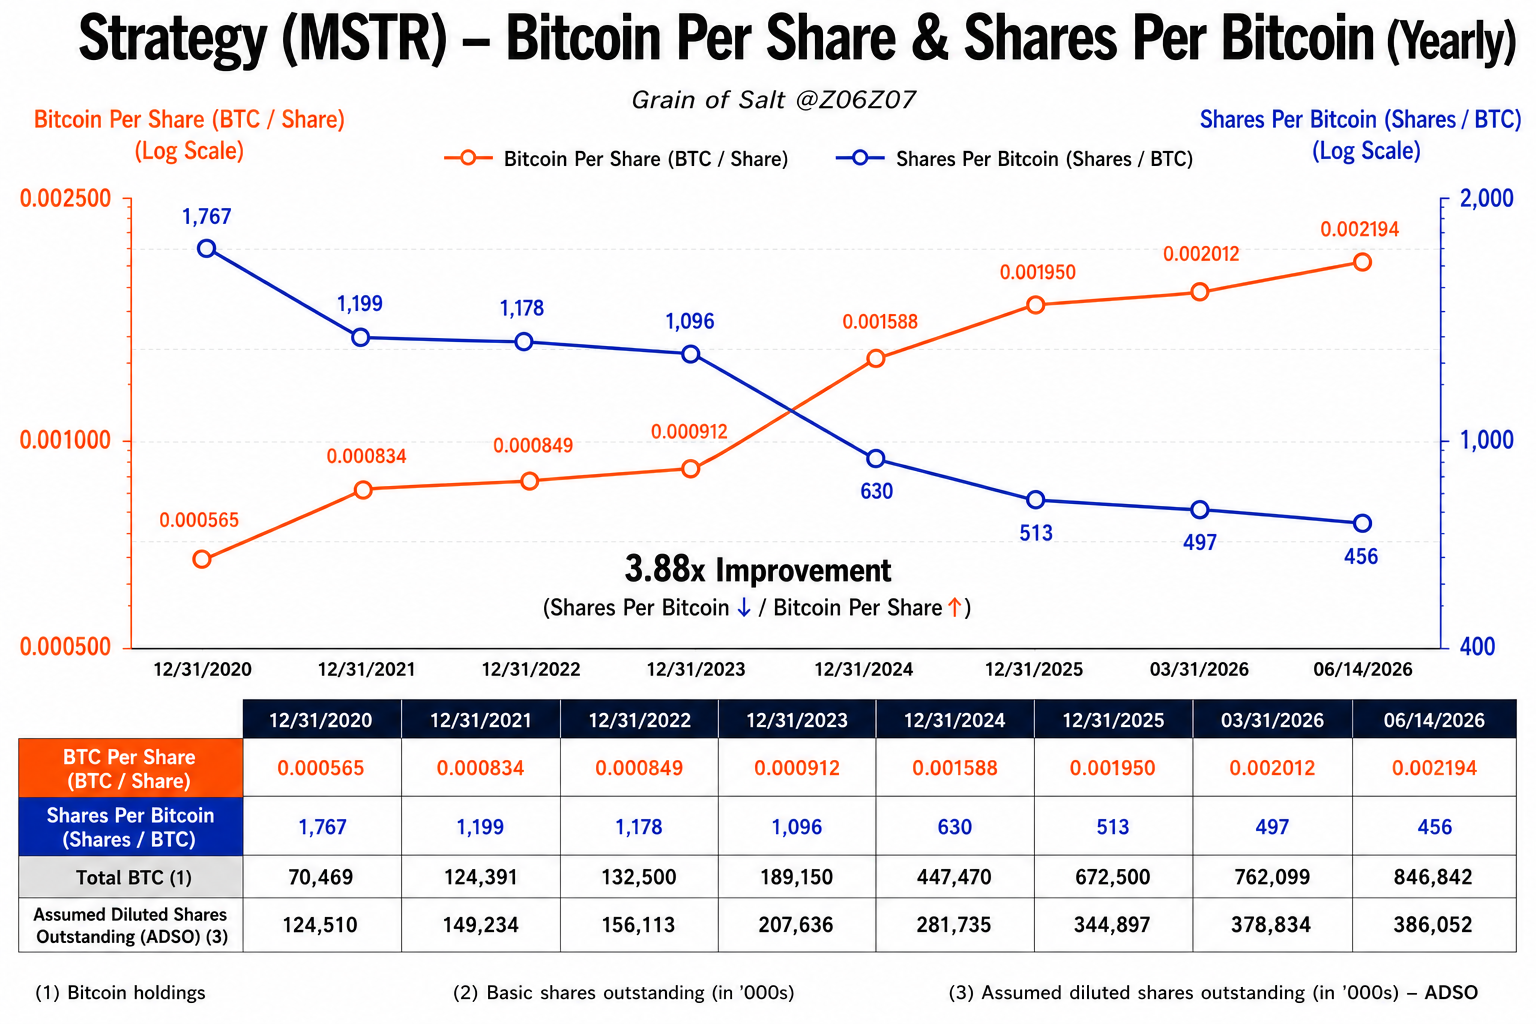
Strategy Bitcoin per share in orange and shares per Bitcoin in blue, plotted yearly from December 31, 2020 to June 14, 2026, with a callout reading 3.88x Improvement
06

Bitcoin Holdings Growth versus Share Growth
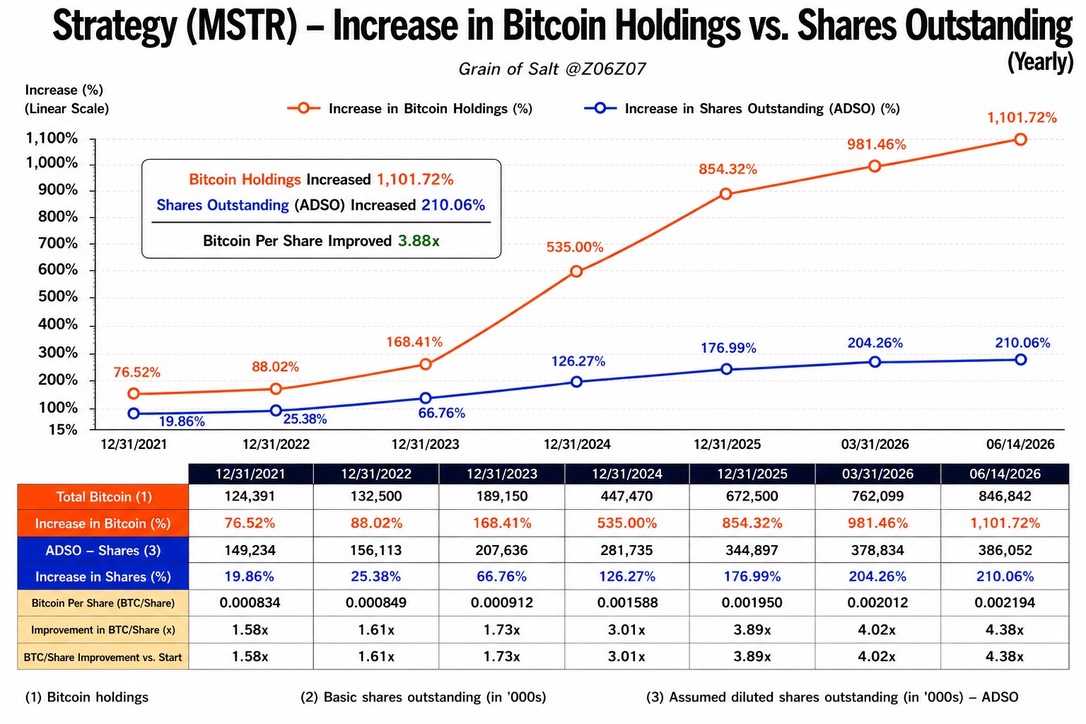
Bitcoin Holdings Growth versus Share Growth

02 Amplification

10 images
31

Strategy’s Bitcoin Acquisition Playbook

Through October 30, 2026 · Historical financing and acquisition analysis

Spot and estimated issuance mNAV, Bitcoin acquisitions and sales, convertible financing, and preferred capital. Read the chart’s methodology and source notes; estimated issuance mNAV is not actual ATM execution pricing.
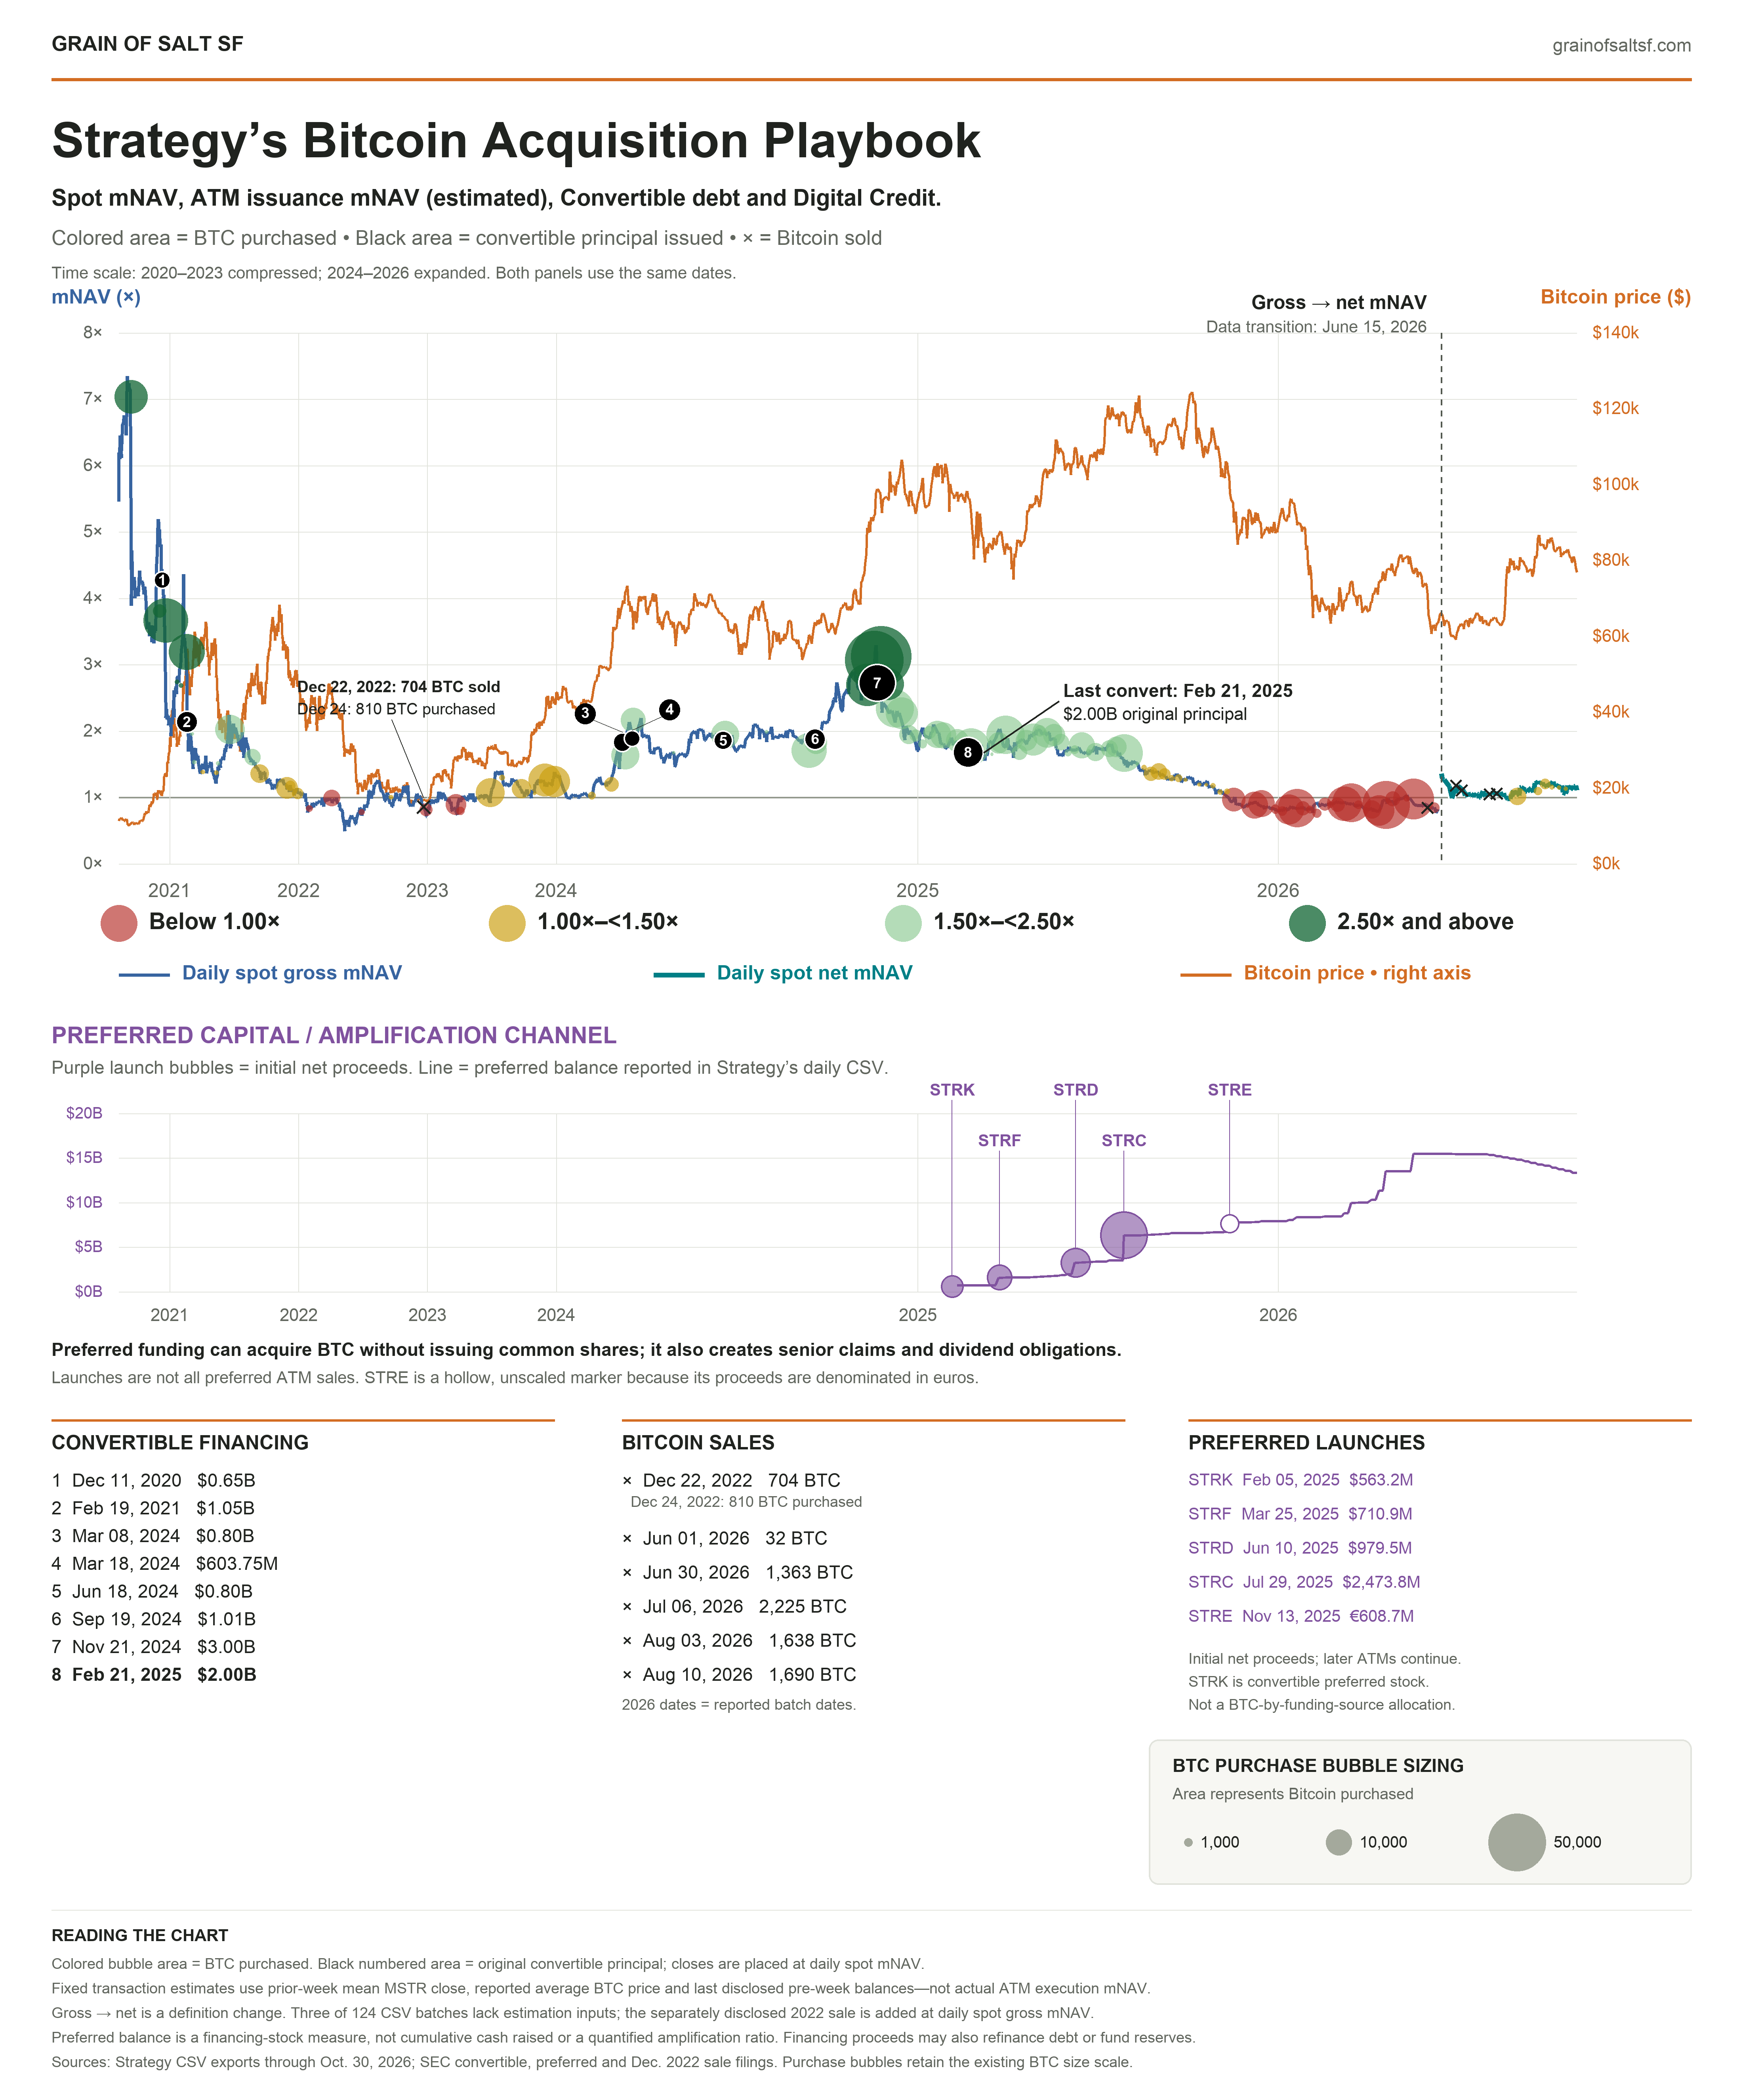
Original two-panel Strategy Bitcoin acquisition plot: acquisition-sized bubbles and convertible financing markers overlay blue spot gross mNAV, teal spot net mNAV, and orange Bitcoin price in the upper panel; purple preferred capital balances and launch bubbles appear in the lower panel, with methodology and source notes below.Expand original image · 4400 × 5300
07

Why Amplification Falls as Bitcoin Rises
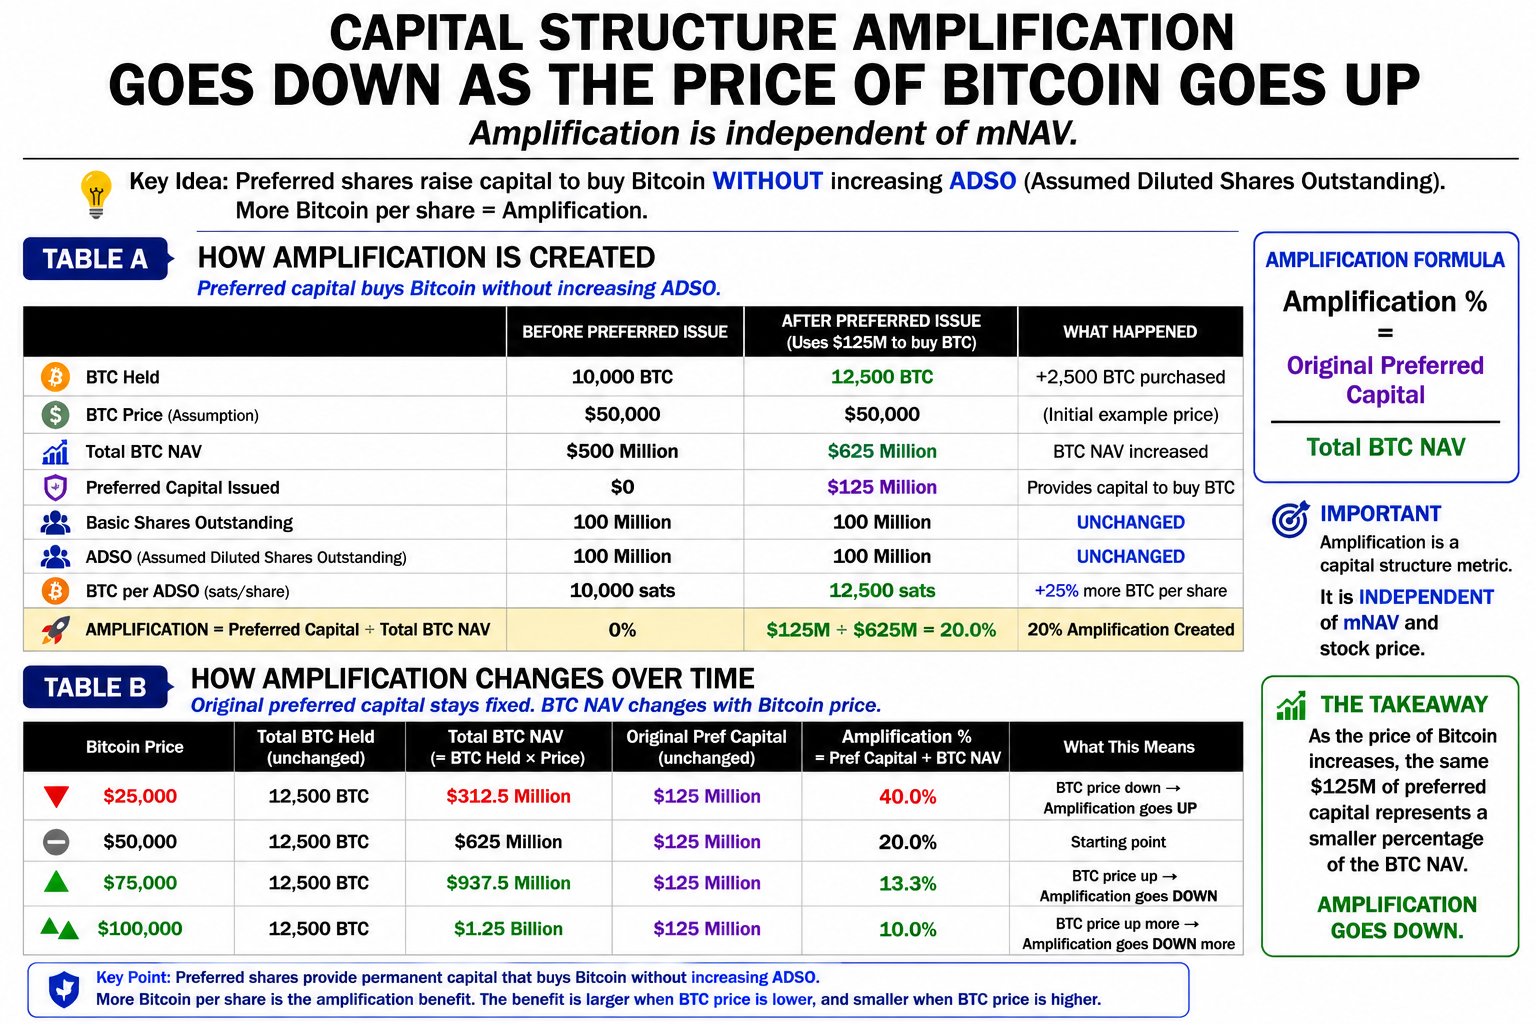
Why Amplification Falls as Bitcoin Rises
08

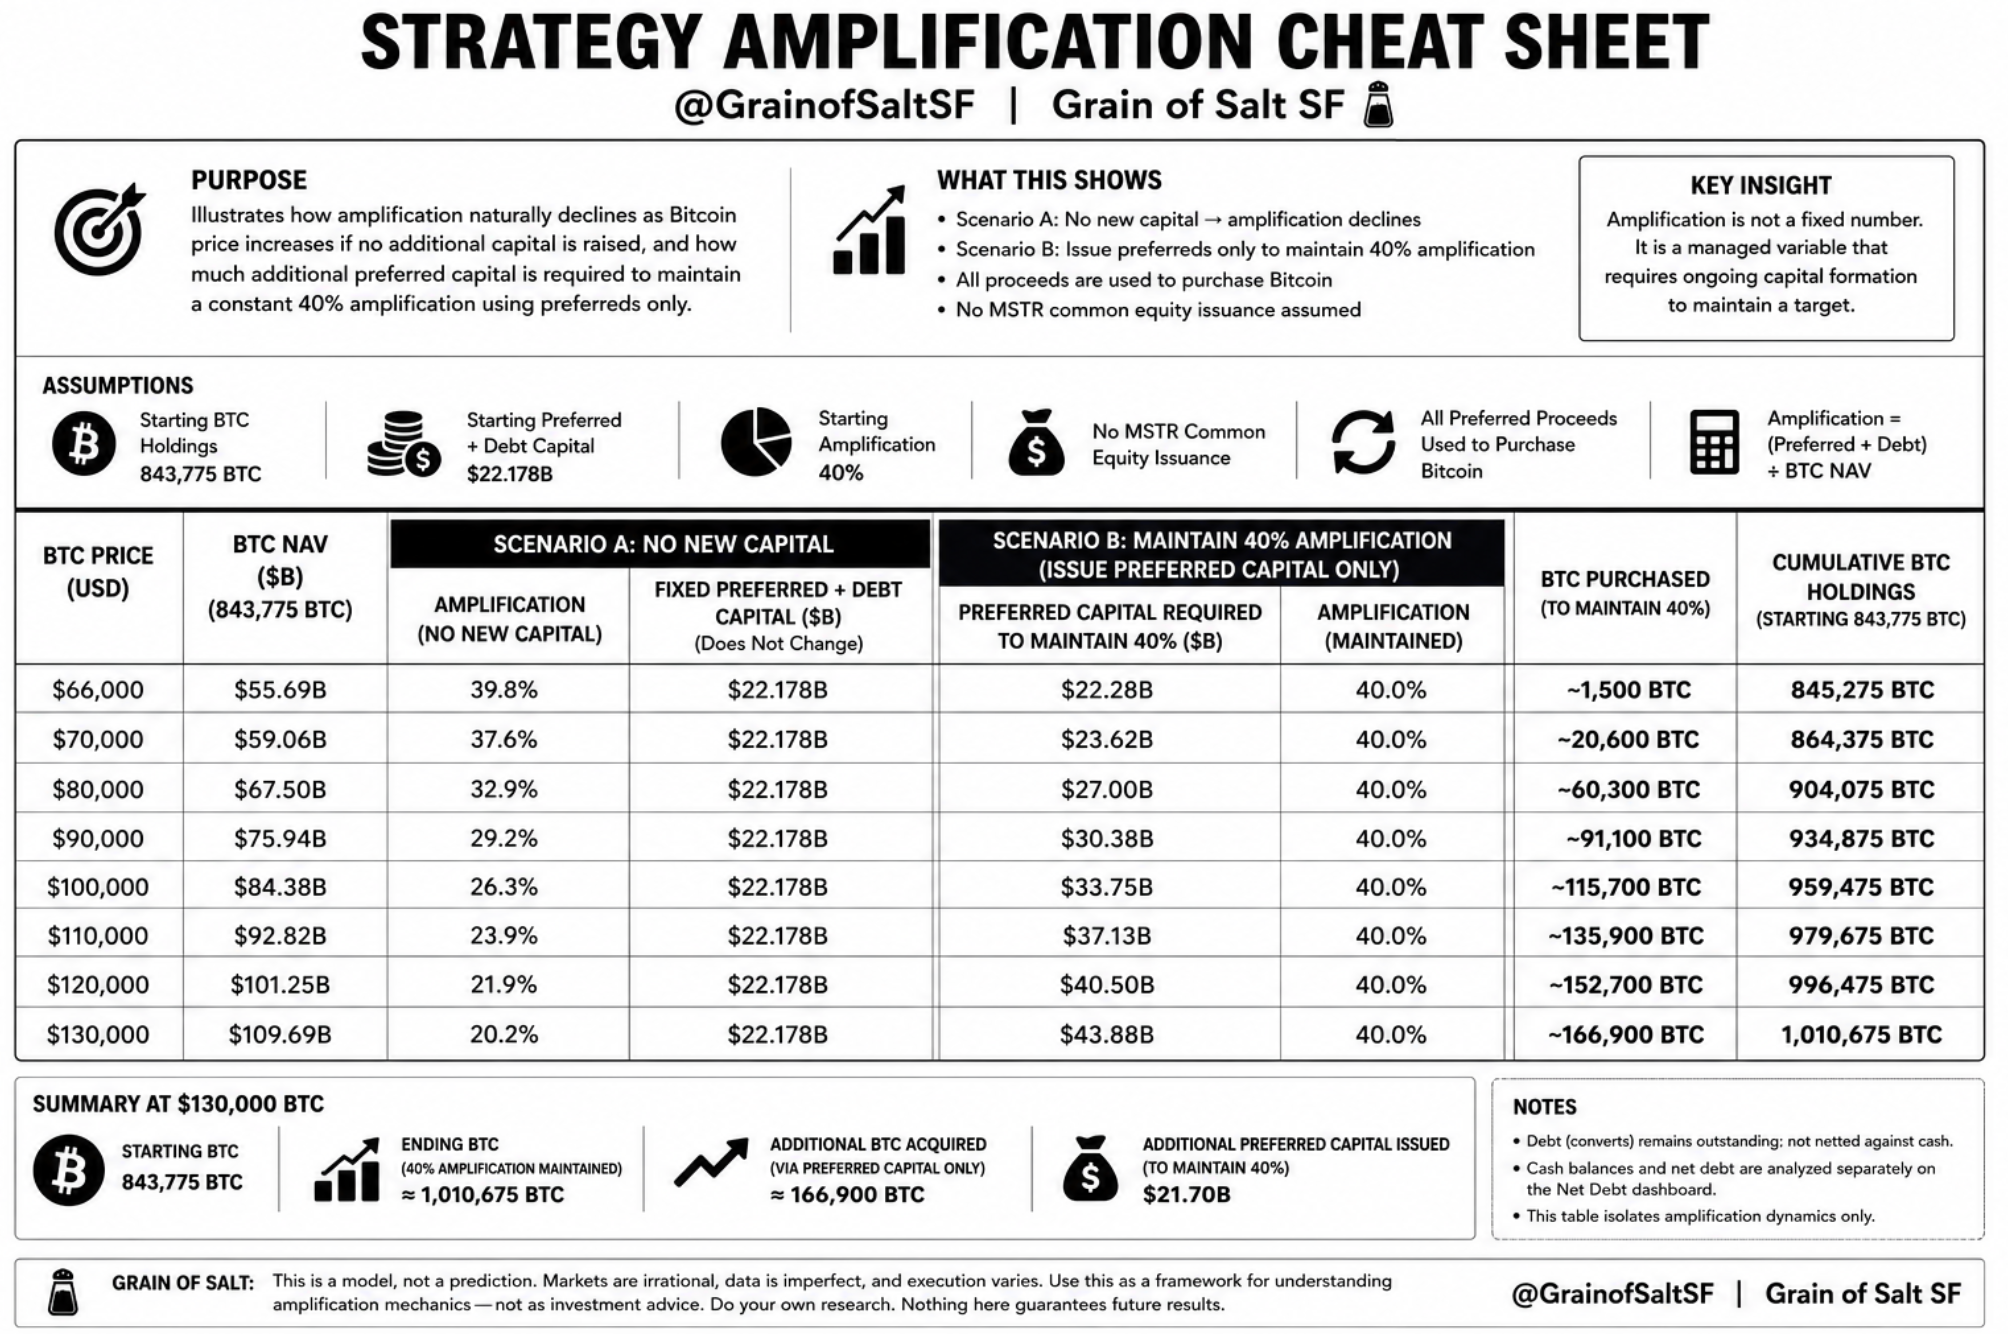
Strategy Amplification Cheat Sheet

Strategy Amplification Cheat Sheet
09

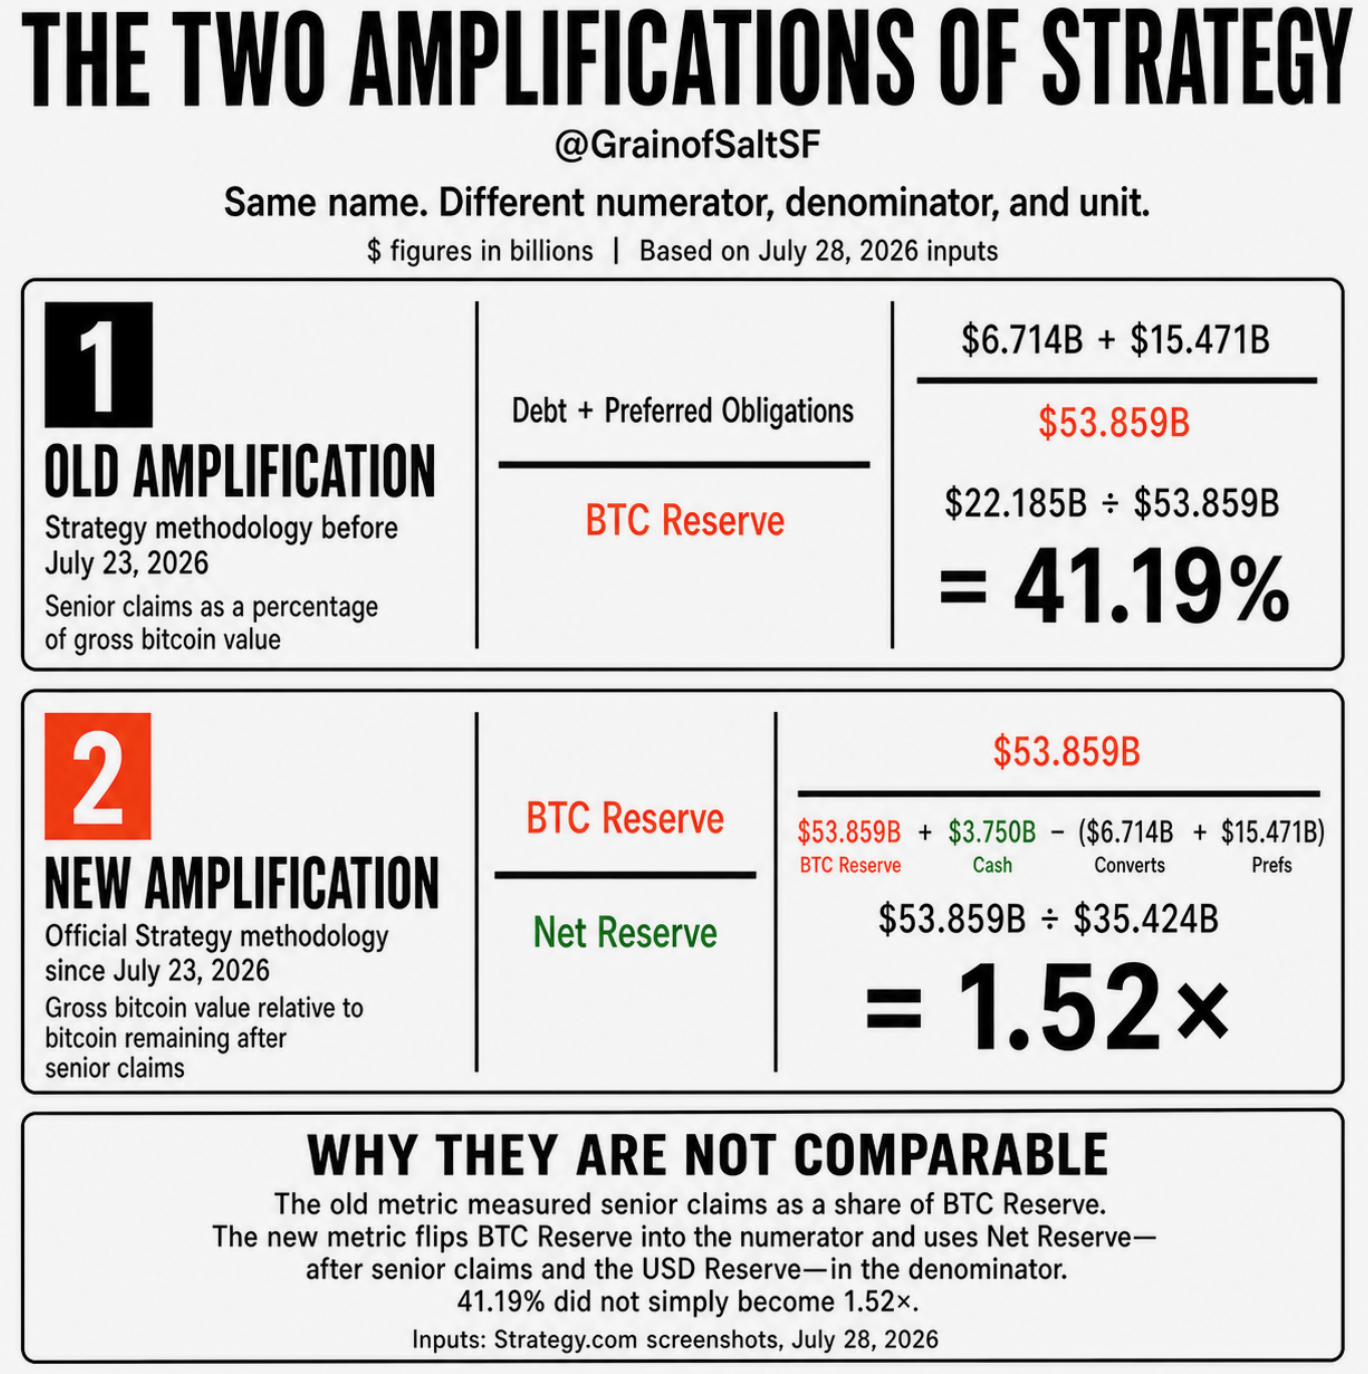
The Two Amplifications of Strategy

The Two Amplifications of Strategy
10

Strategy and Strive at Different Amplification Levels
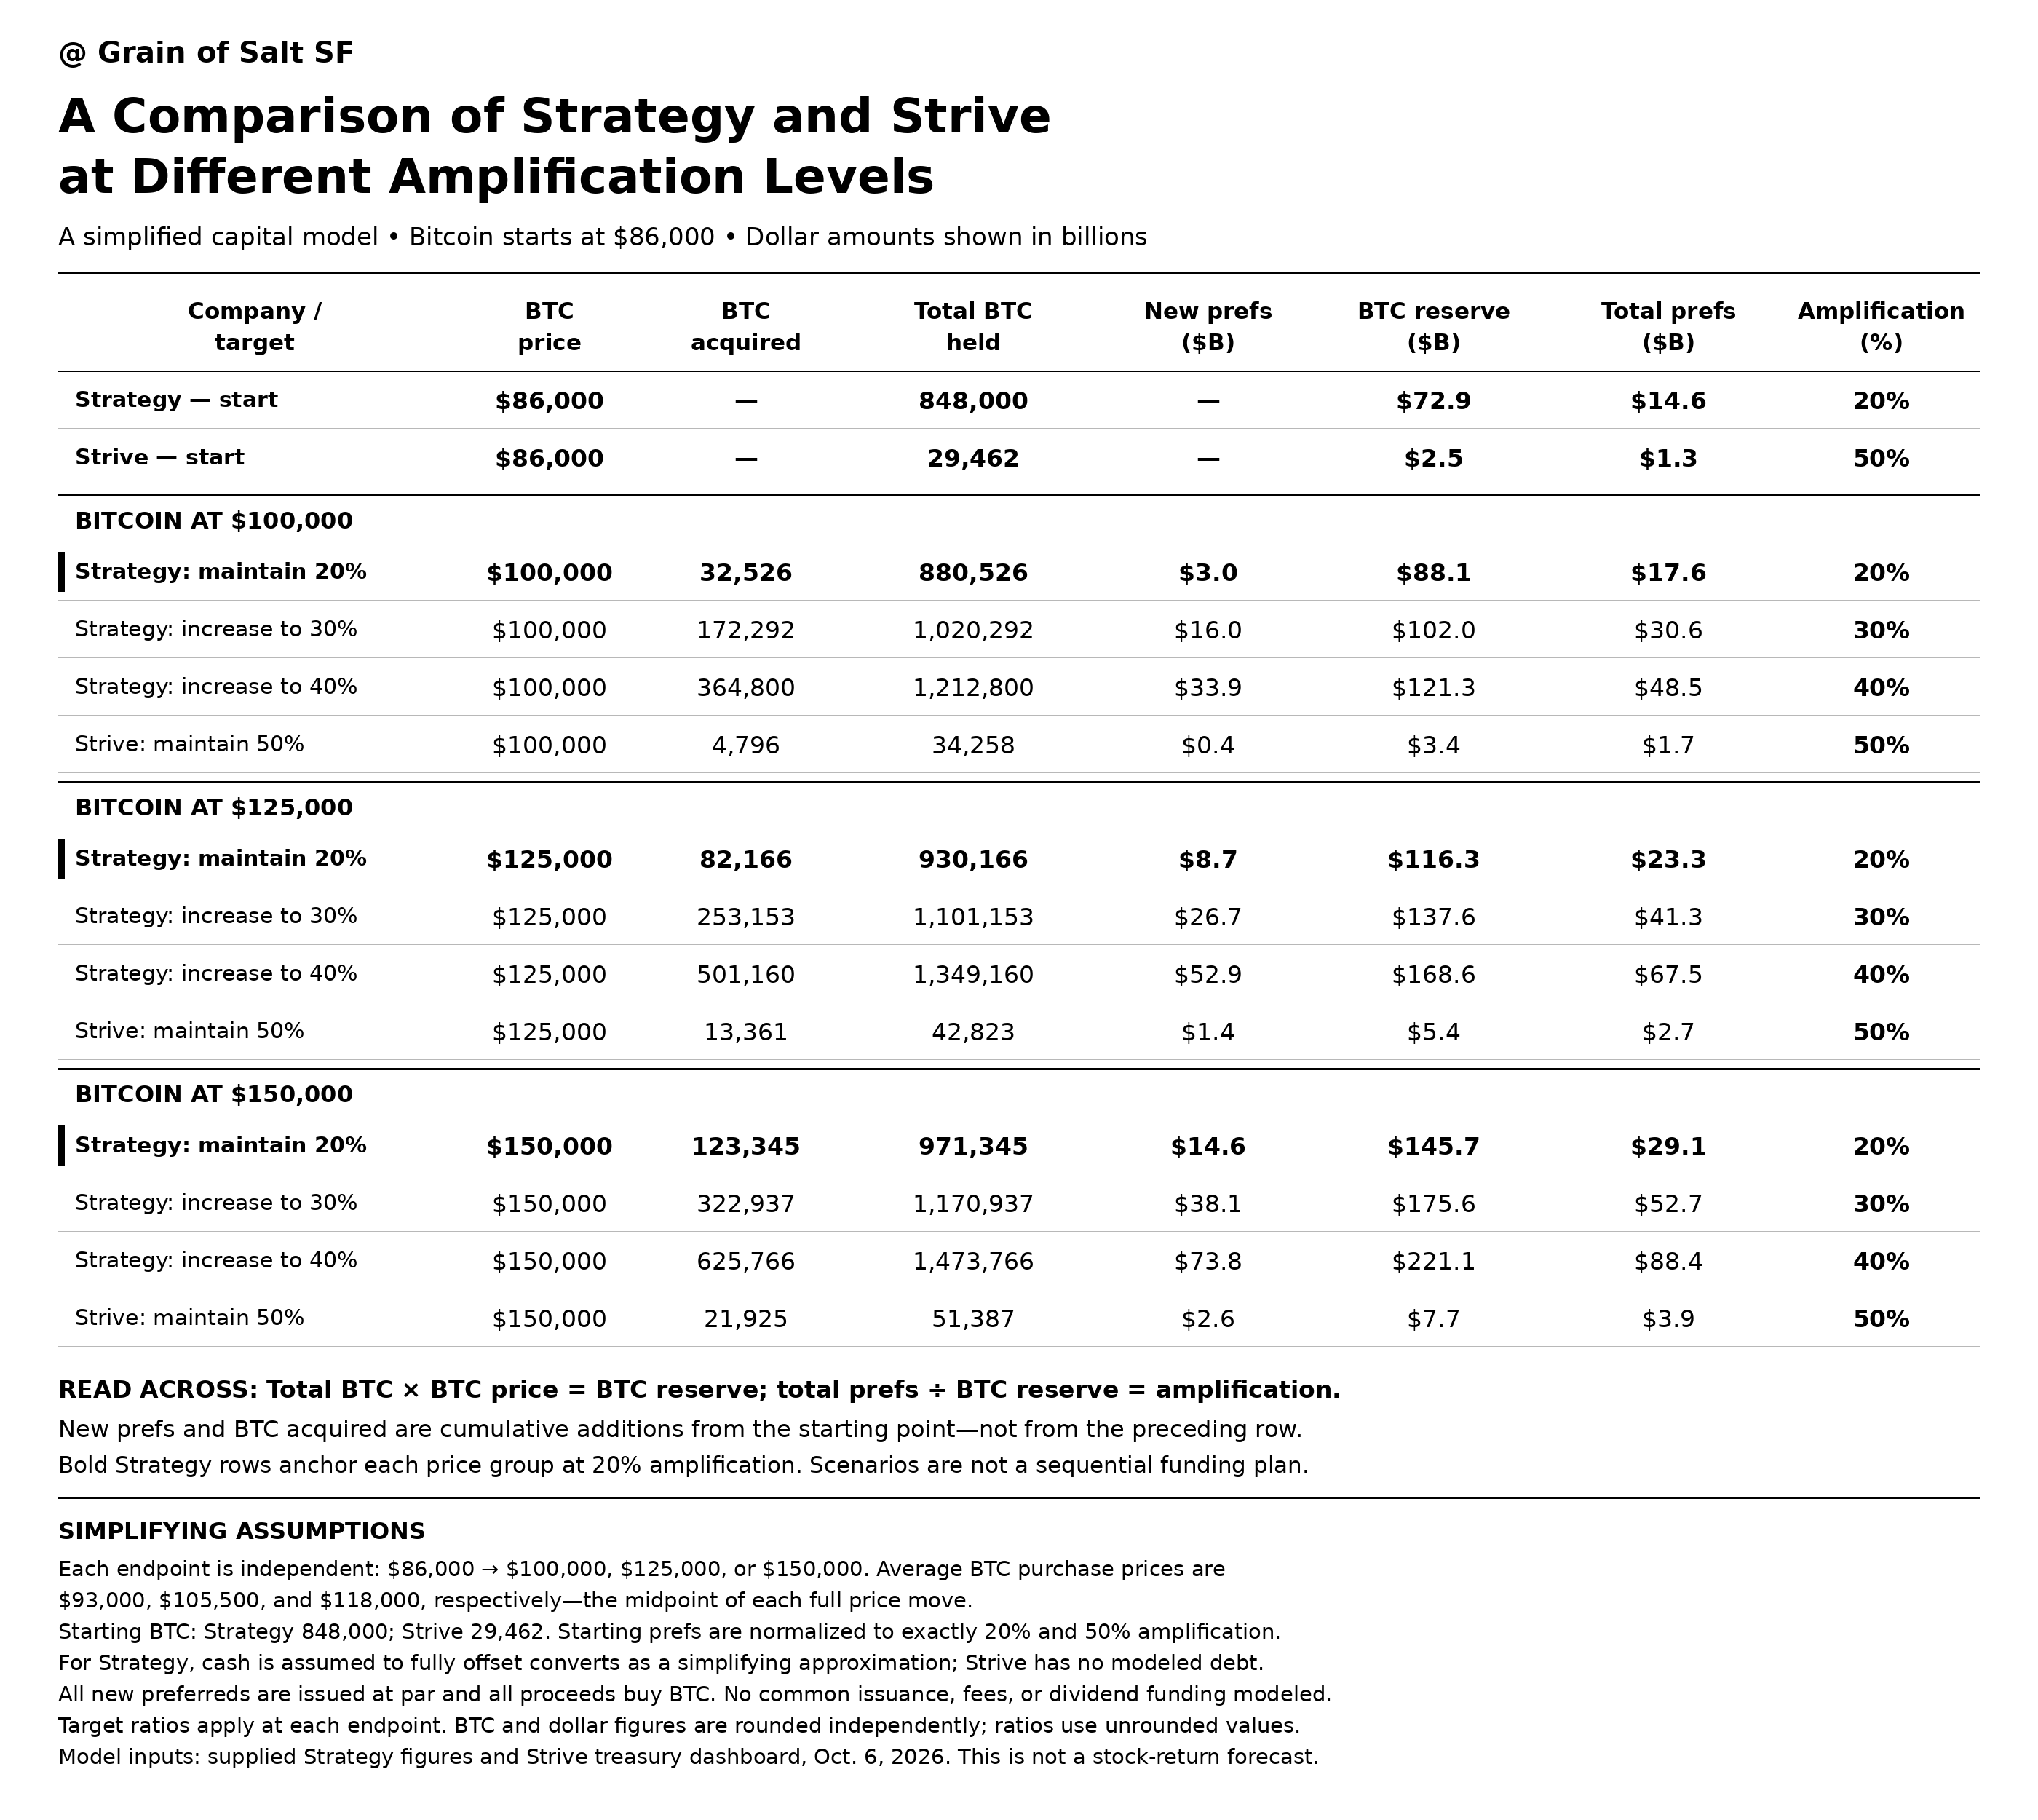
Strategy and Strive at Different Amplification Levels
11

Convexity in Starting Amplification

v1.5
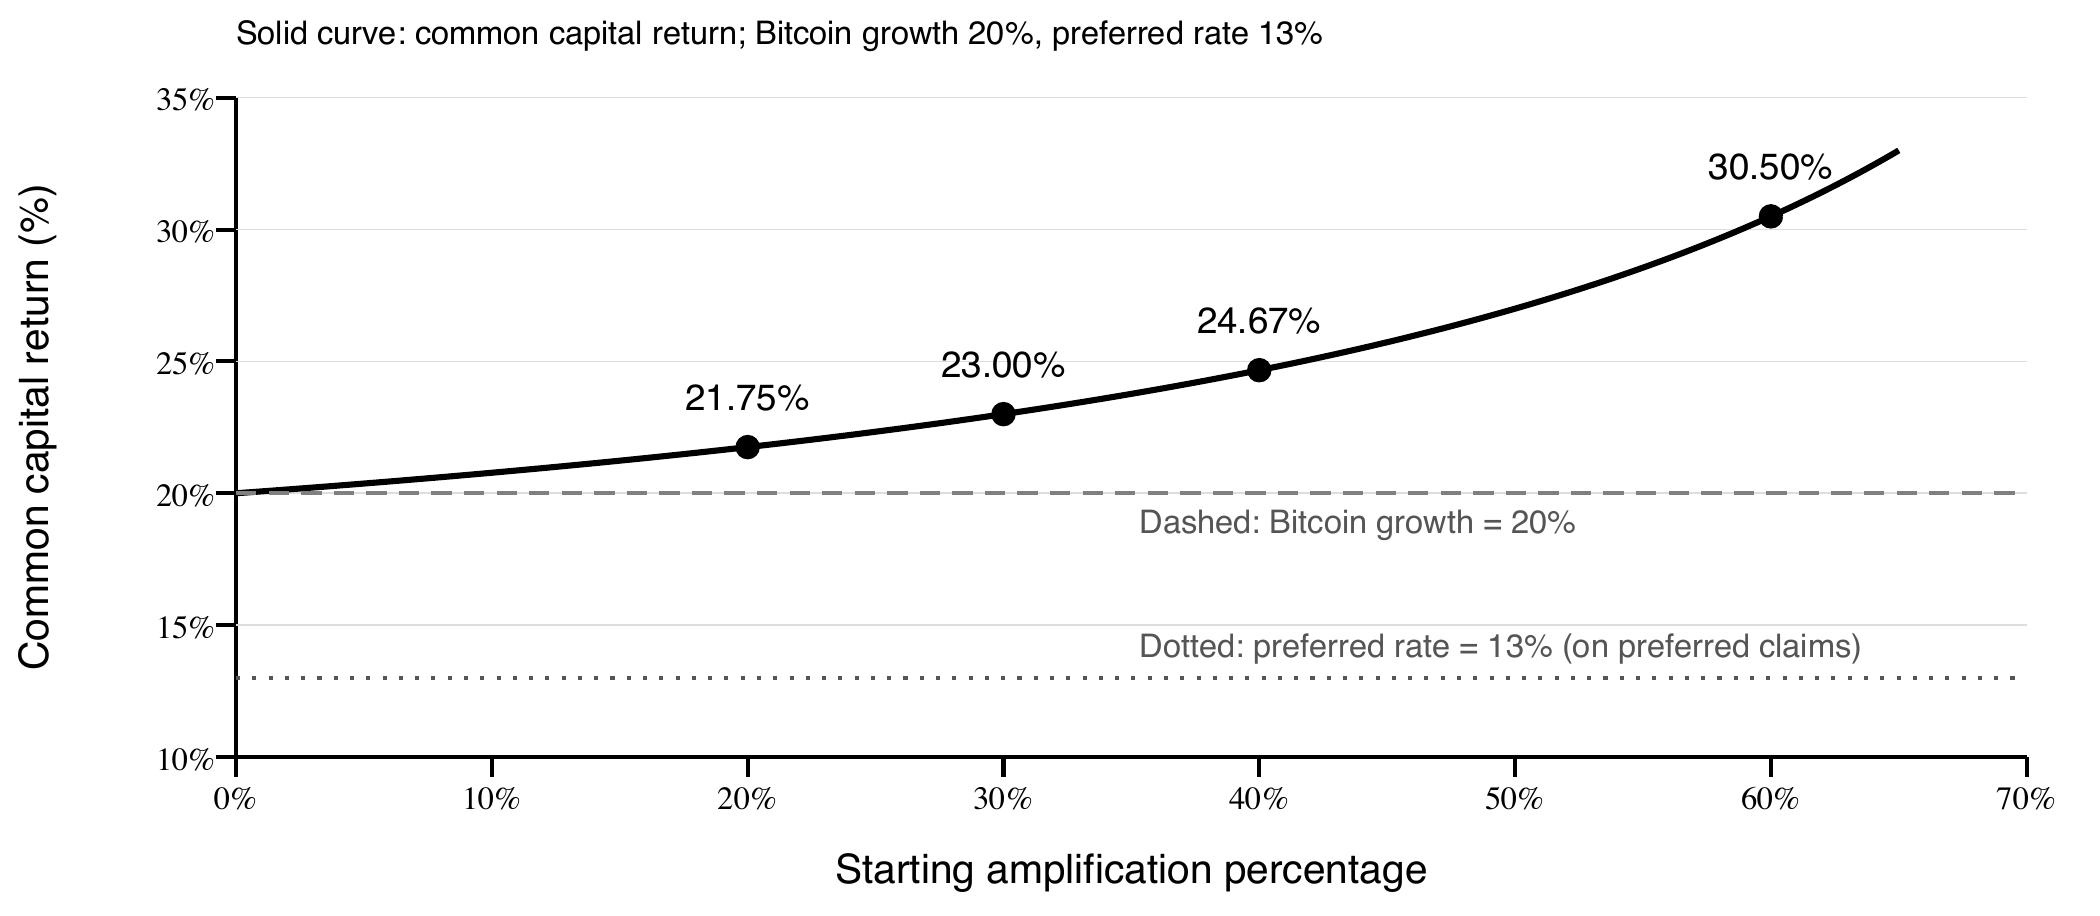
Convexity in Starting Amplification
12

Amplification Convexity across Bitcoin Growth Scenarios
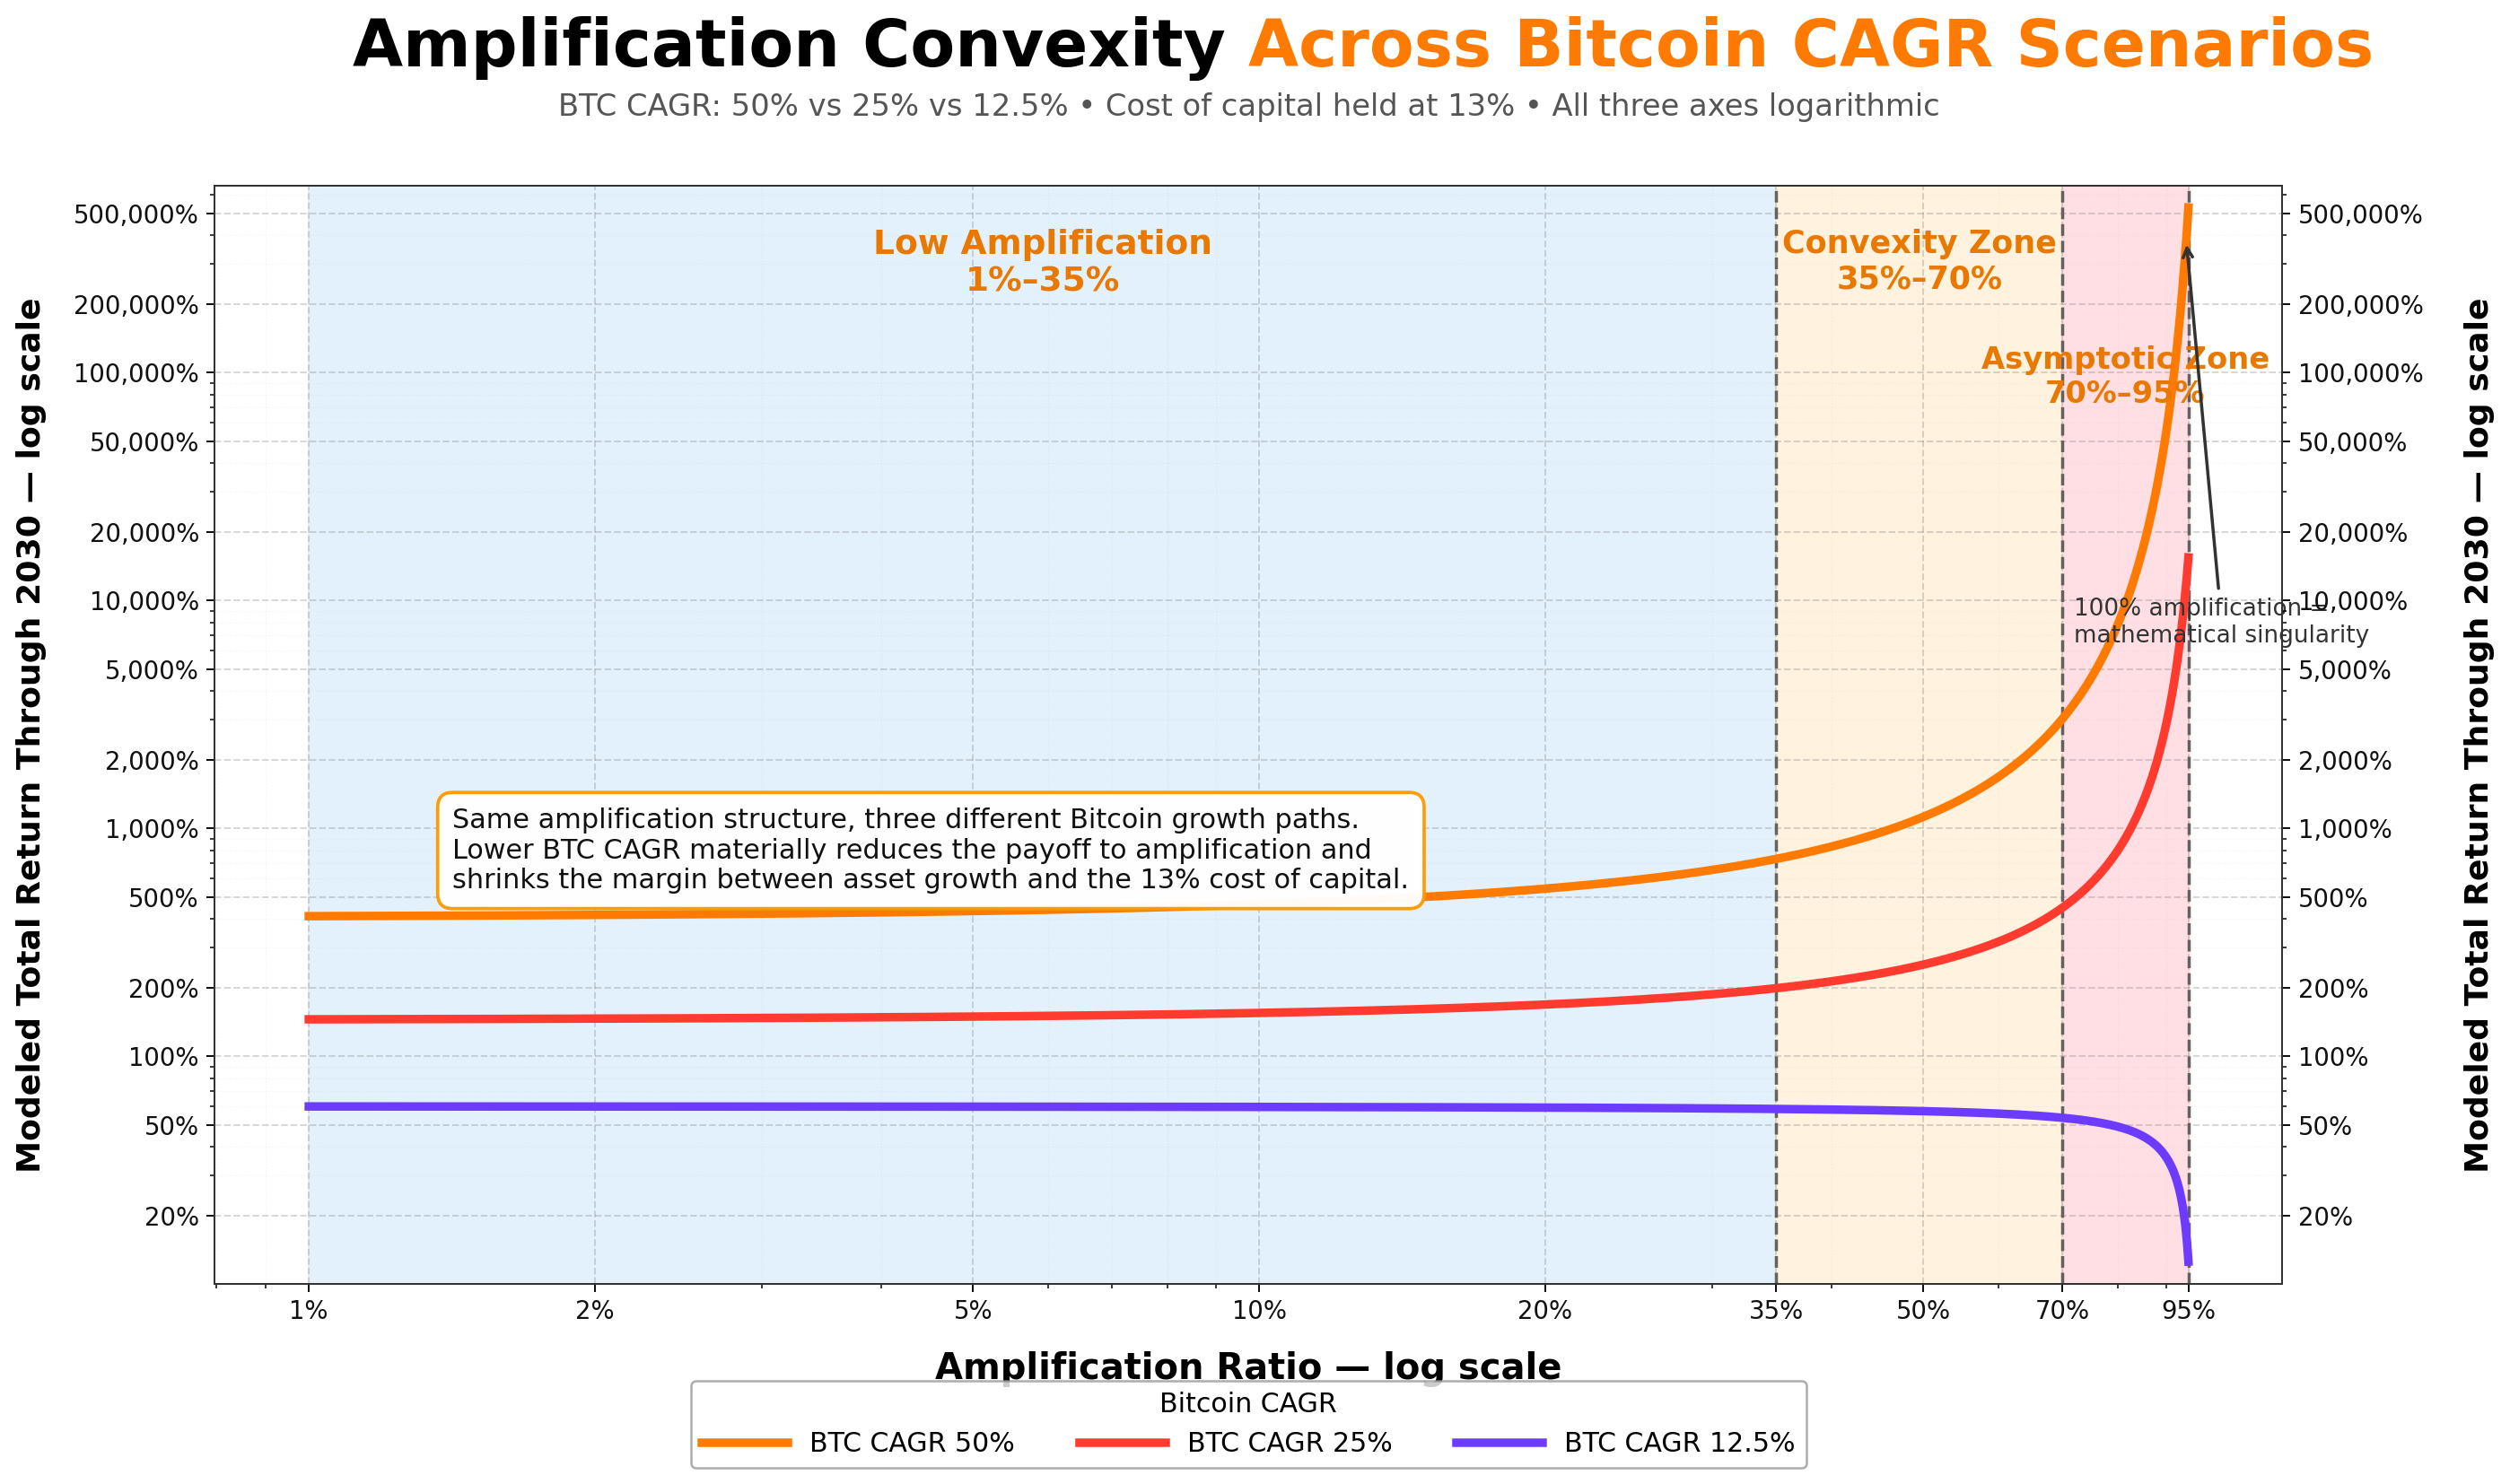
Amplification Convexity across Bitcoin Growth Scenarios
13

Amplification Convexity across Positive Yield Spreads
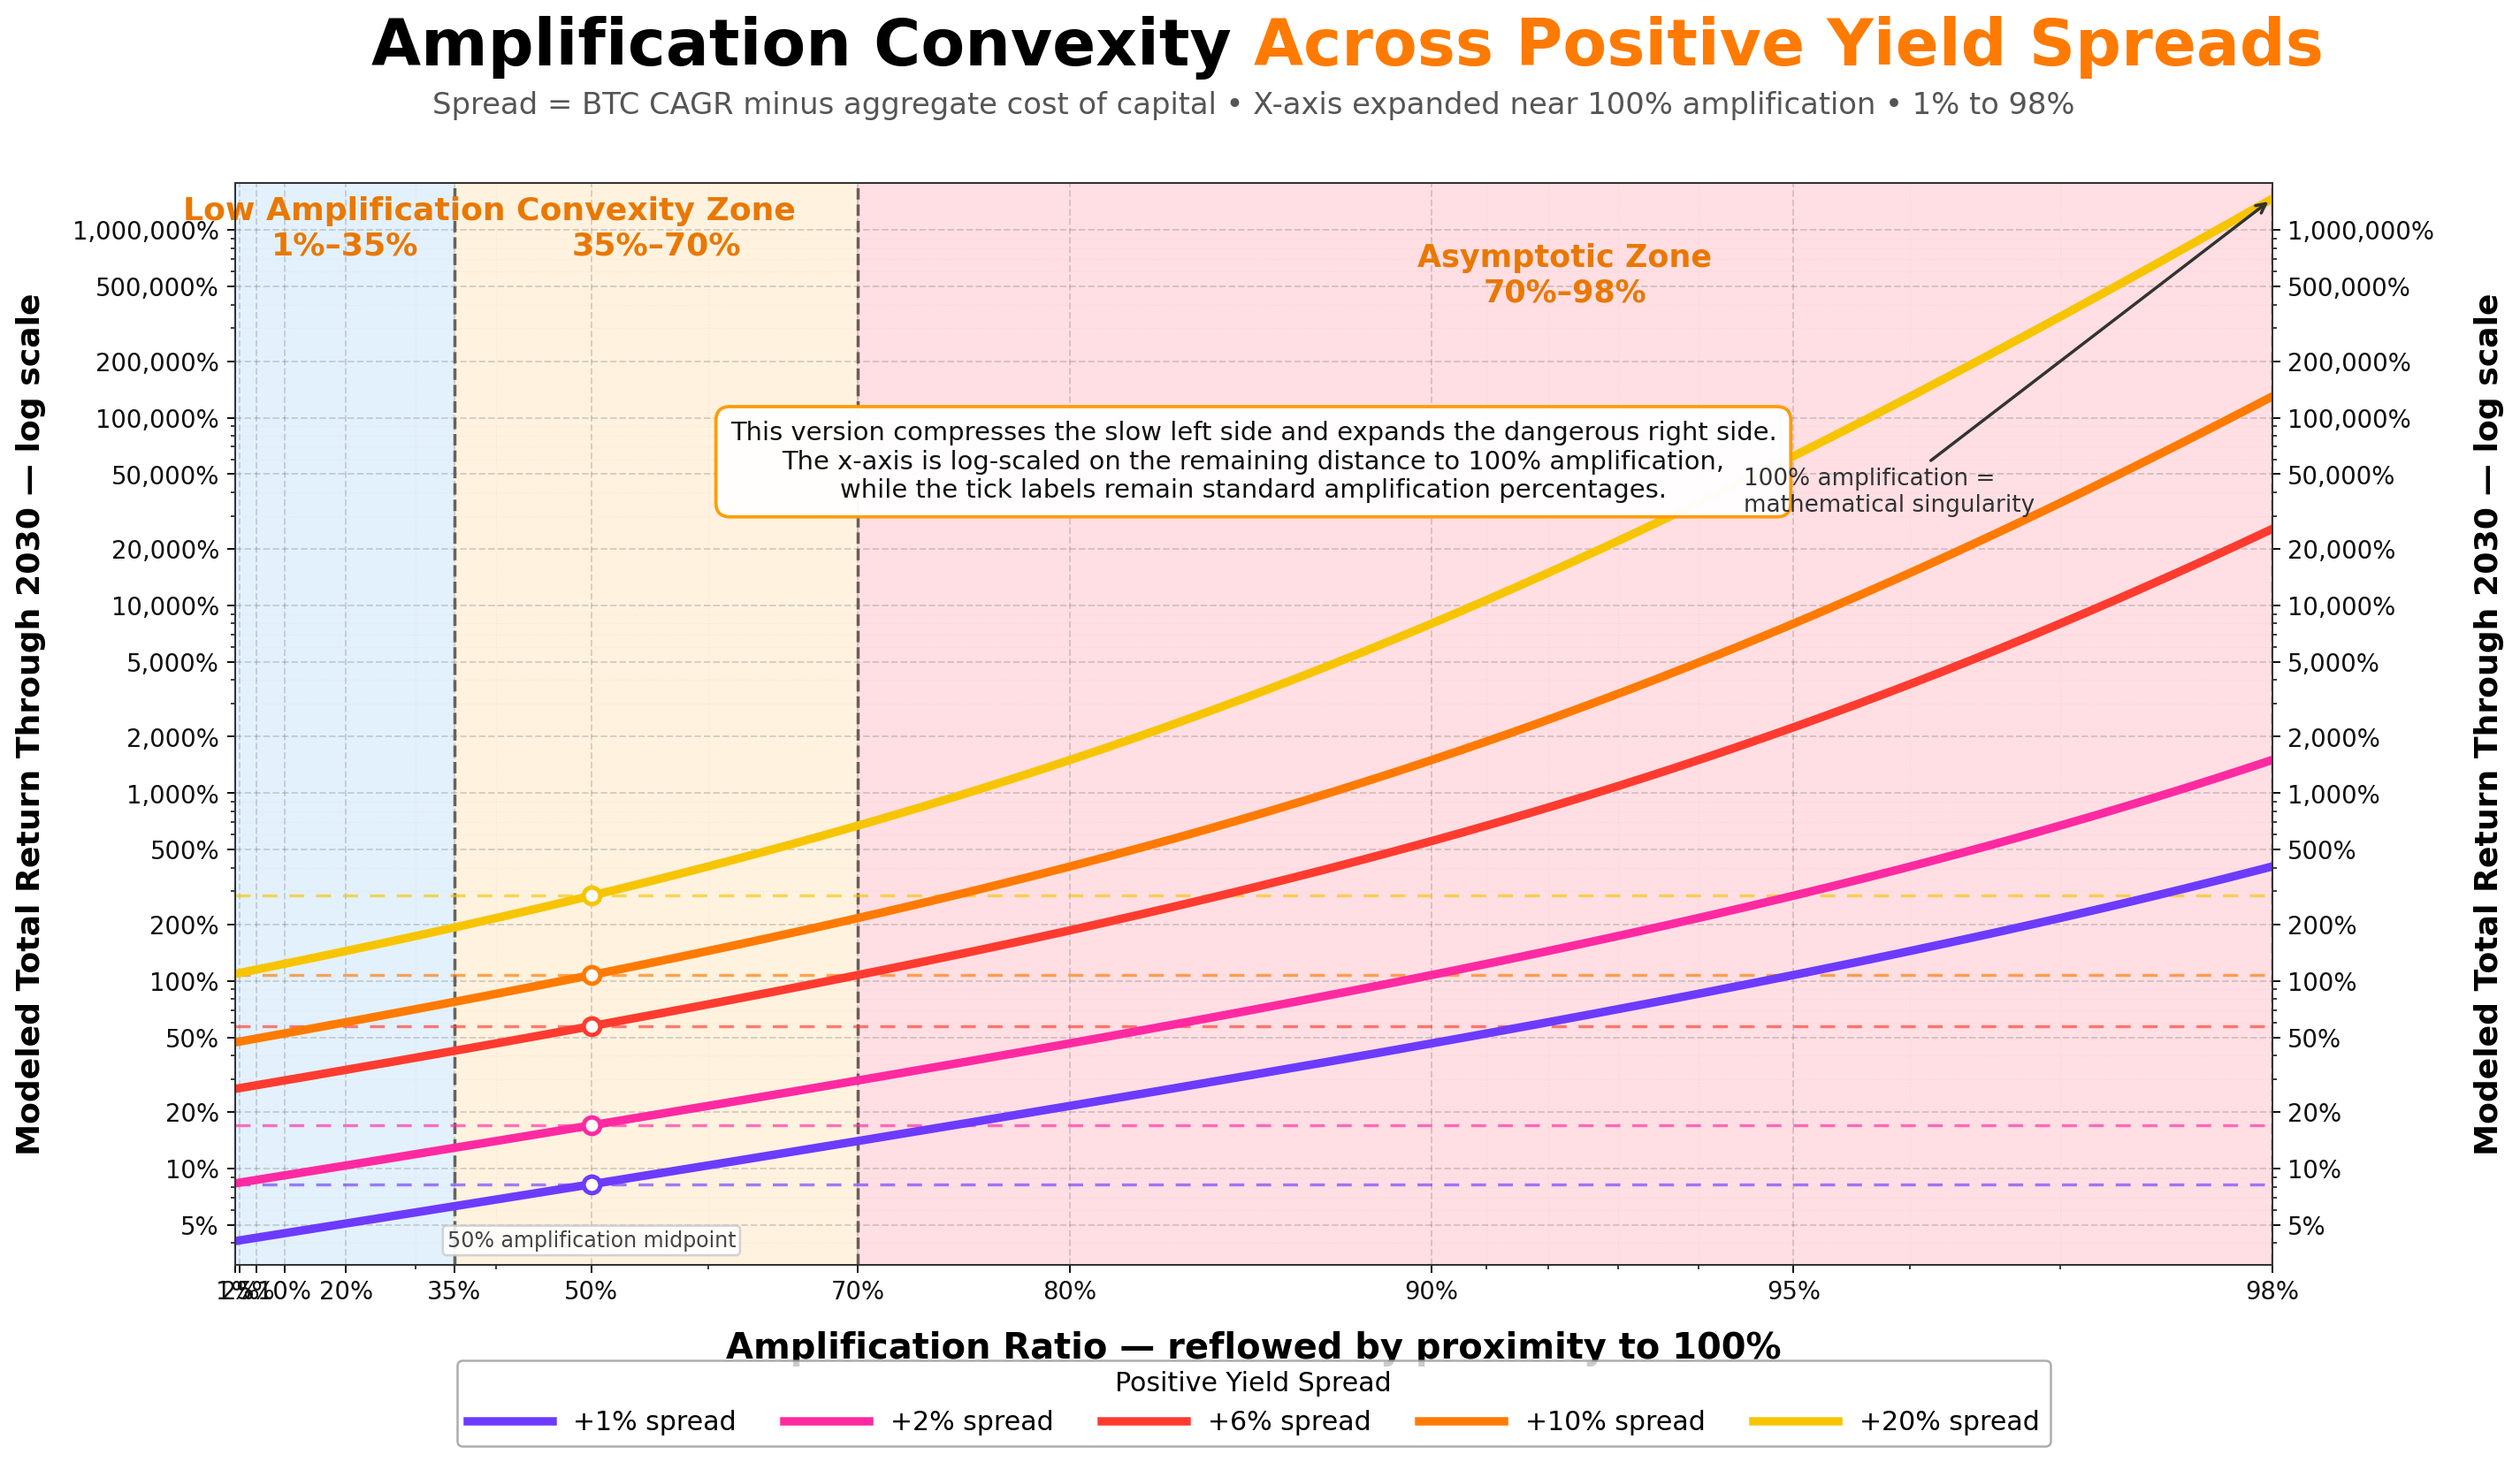
Amplification Convexity across Positive Yield Spreads
14

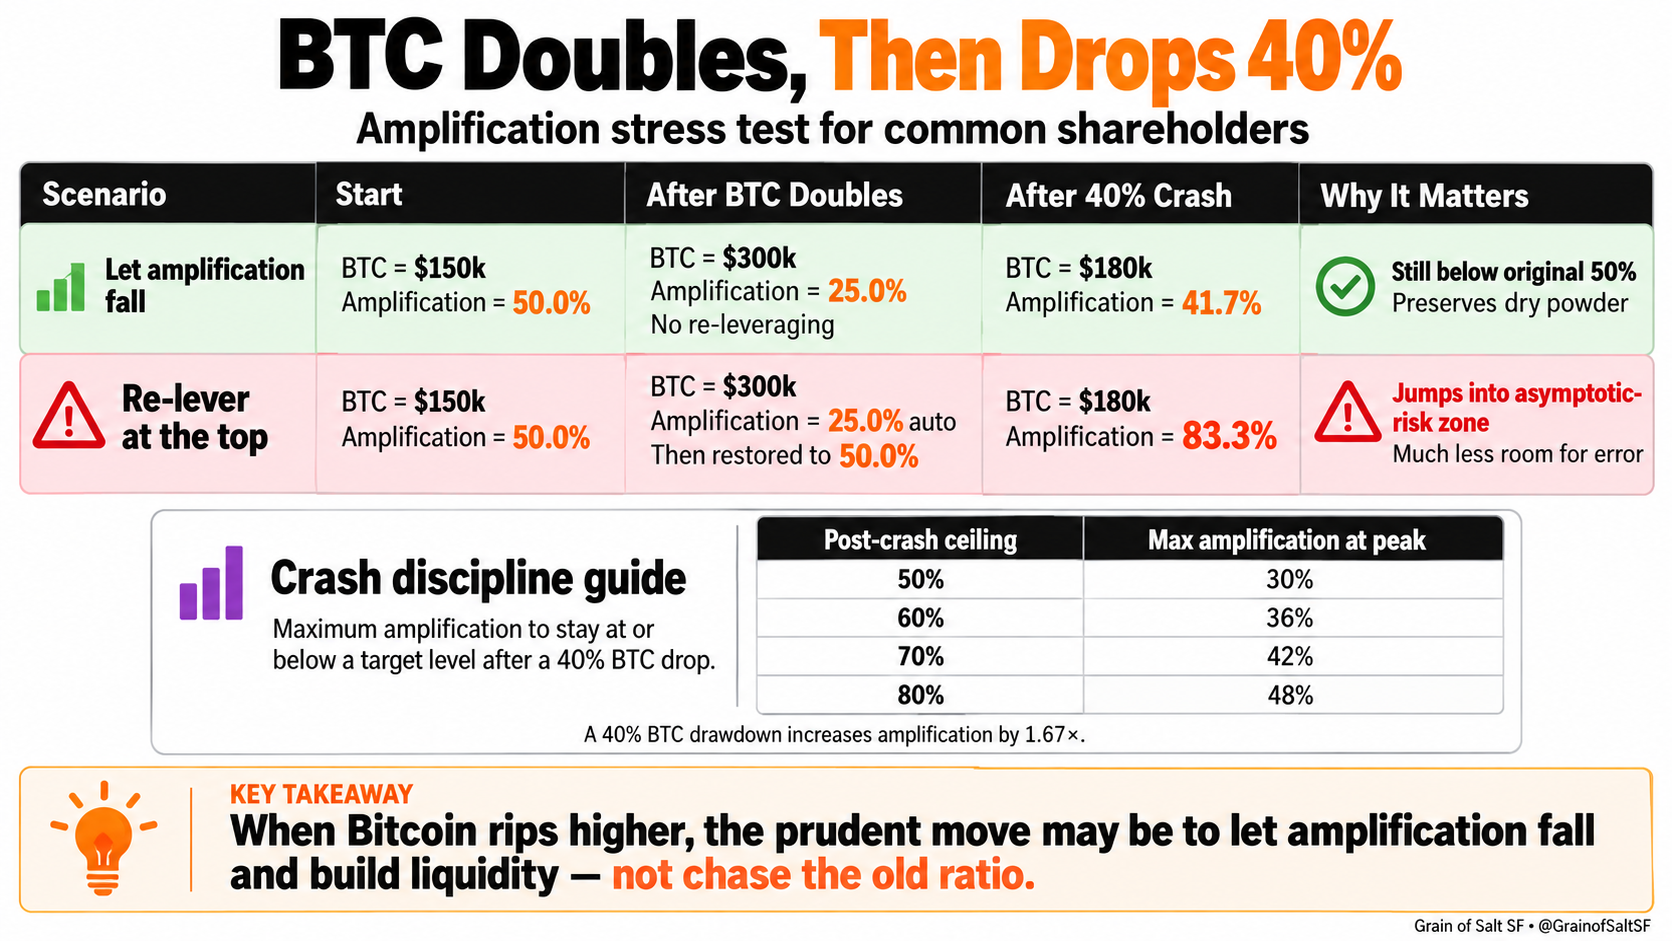
Bitcoin Doubles, Then Drops 40%

White-background amplification stress test: Bitcoin rises from $150k to $300k then drops 40% to $180k; letting amplification fall results in 41.7% versus 83.3% after re-levering at the top, with a crash discipline guide.
15

Why Amplification Should Fall When BTC Rips
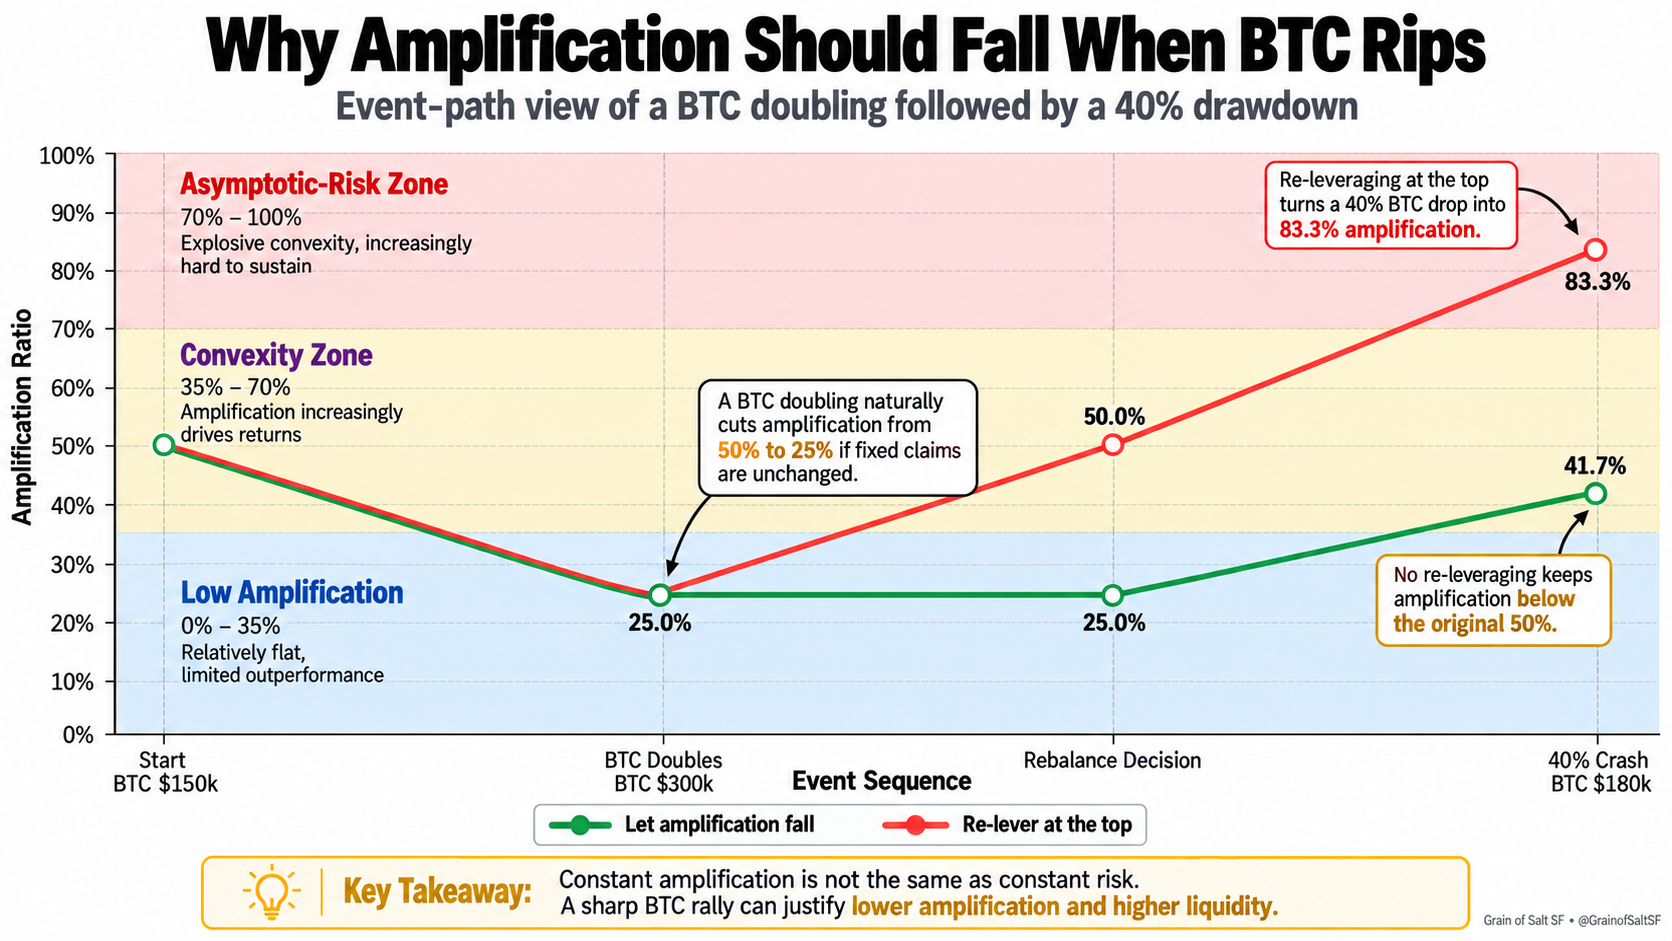
White-background event-path chart: a Bitcoin doubling cuts amplification from 50% to 25%; after a 40% drawdown, no re-leveraging yields 41.7% amplification versus 83.3% after re-leveraging at the top, across low amplification, convexity and asymptotic-risk zones.

03 Leverage

7 images
16

Strategy Cash Reserve History — October 12, 2026

October 12, 2026
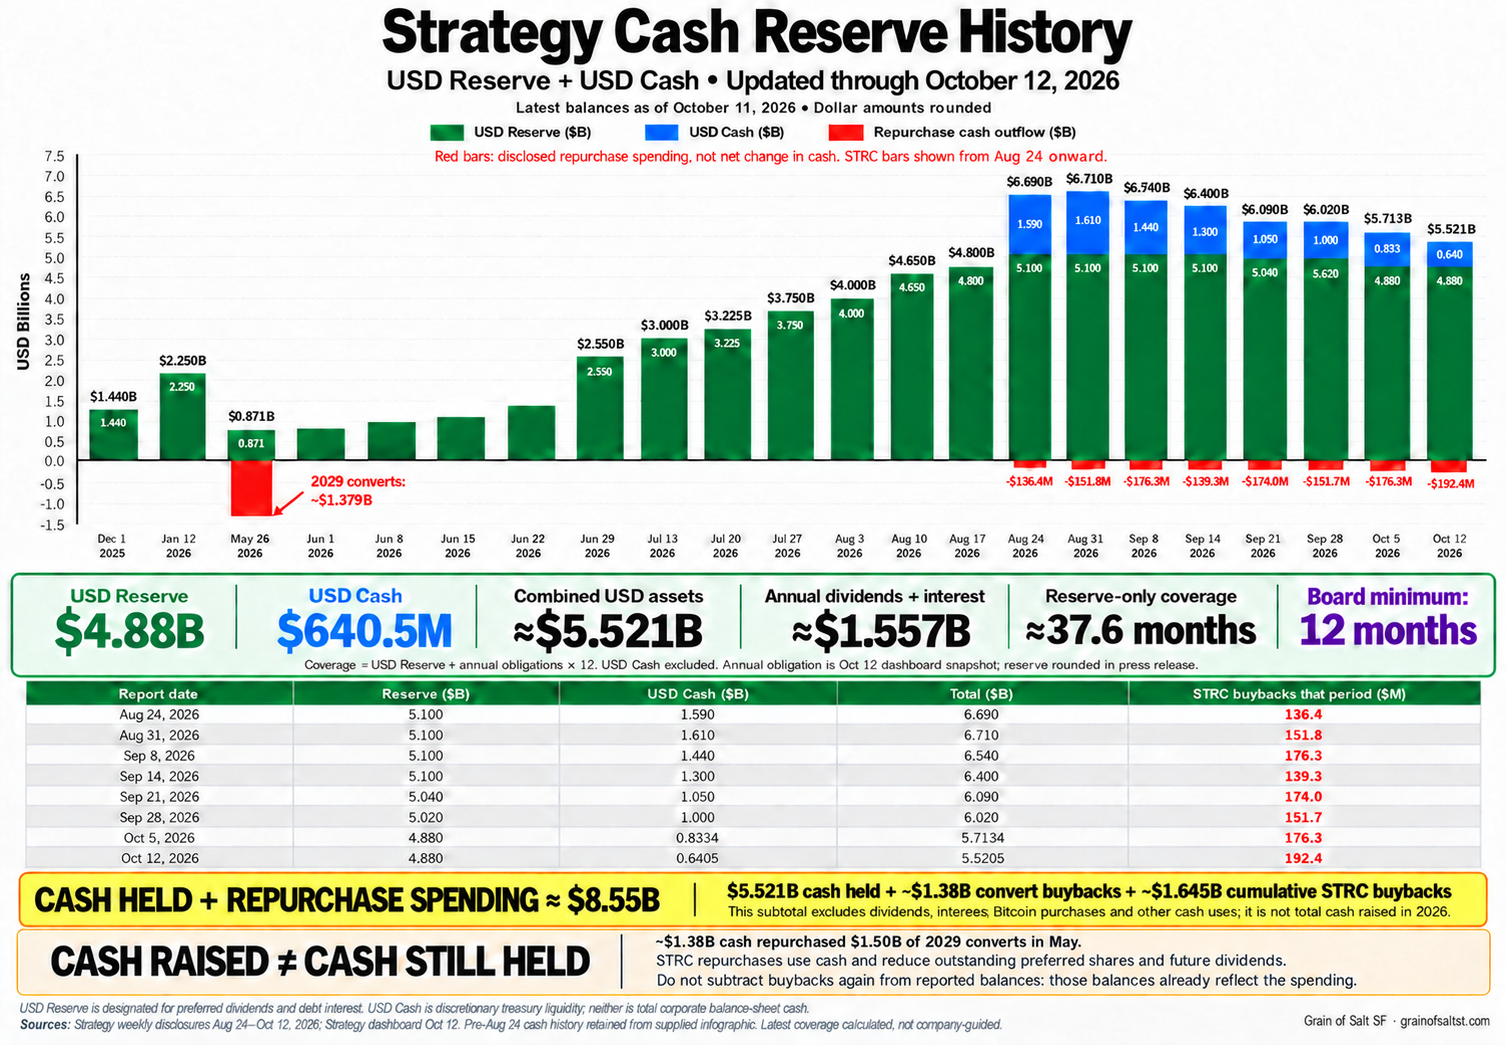
Strategy Cash Reserve History — October 12, 2026
17

Strategy Net Leverage History — October 12, 2026

October 12, 2026
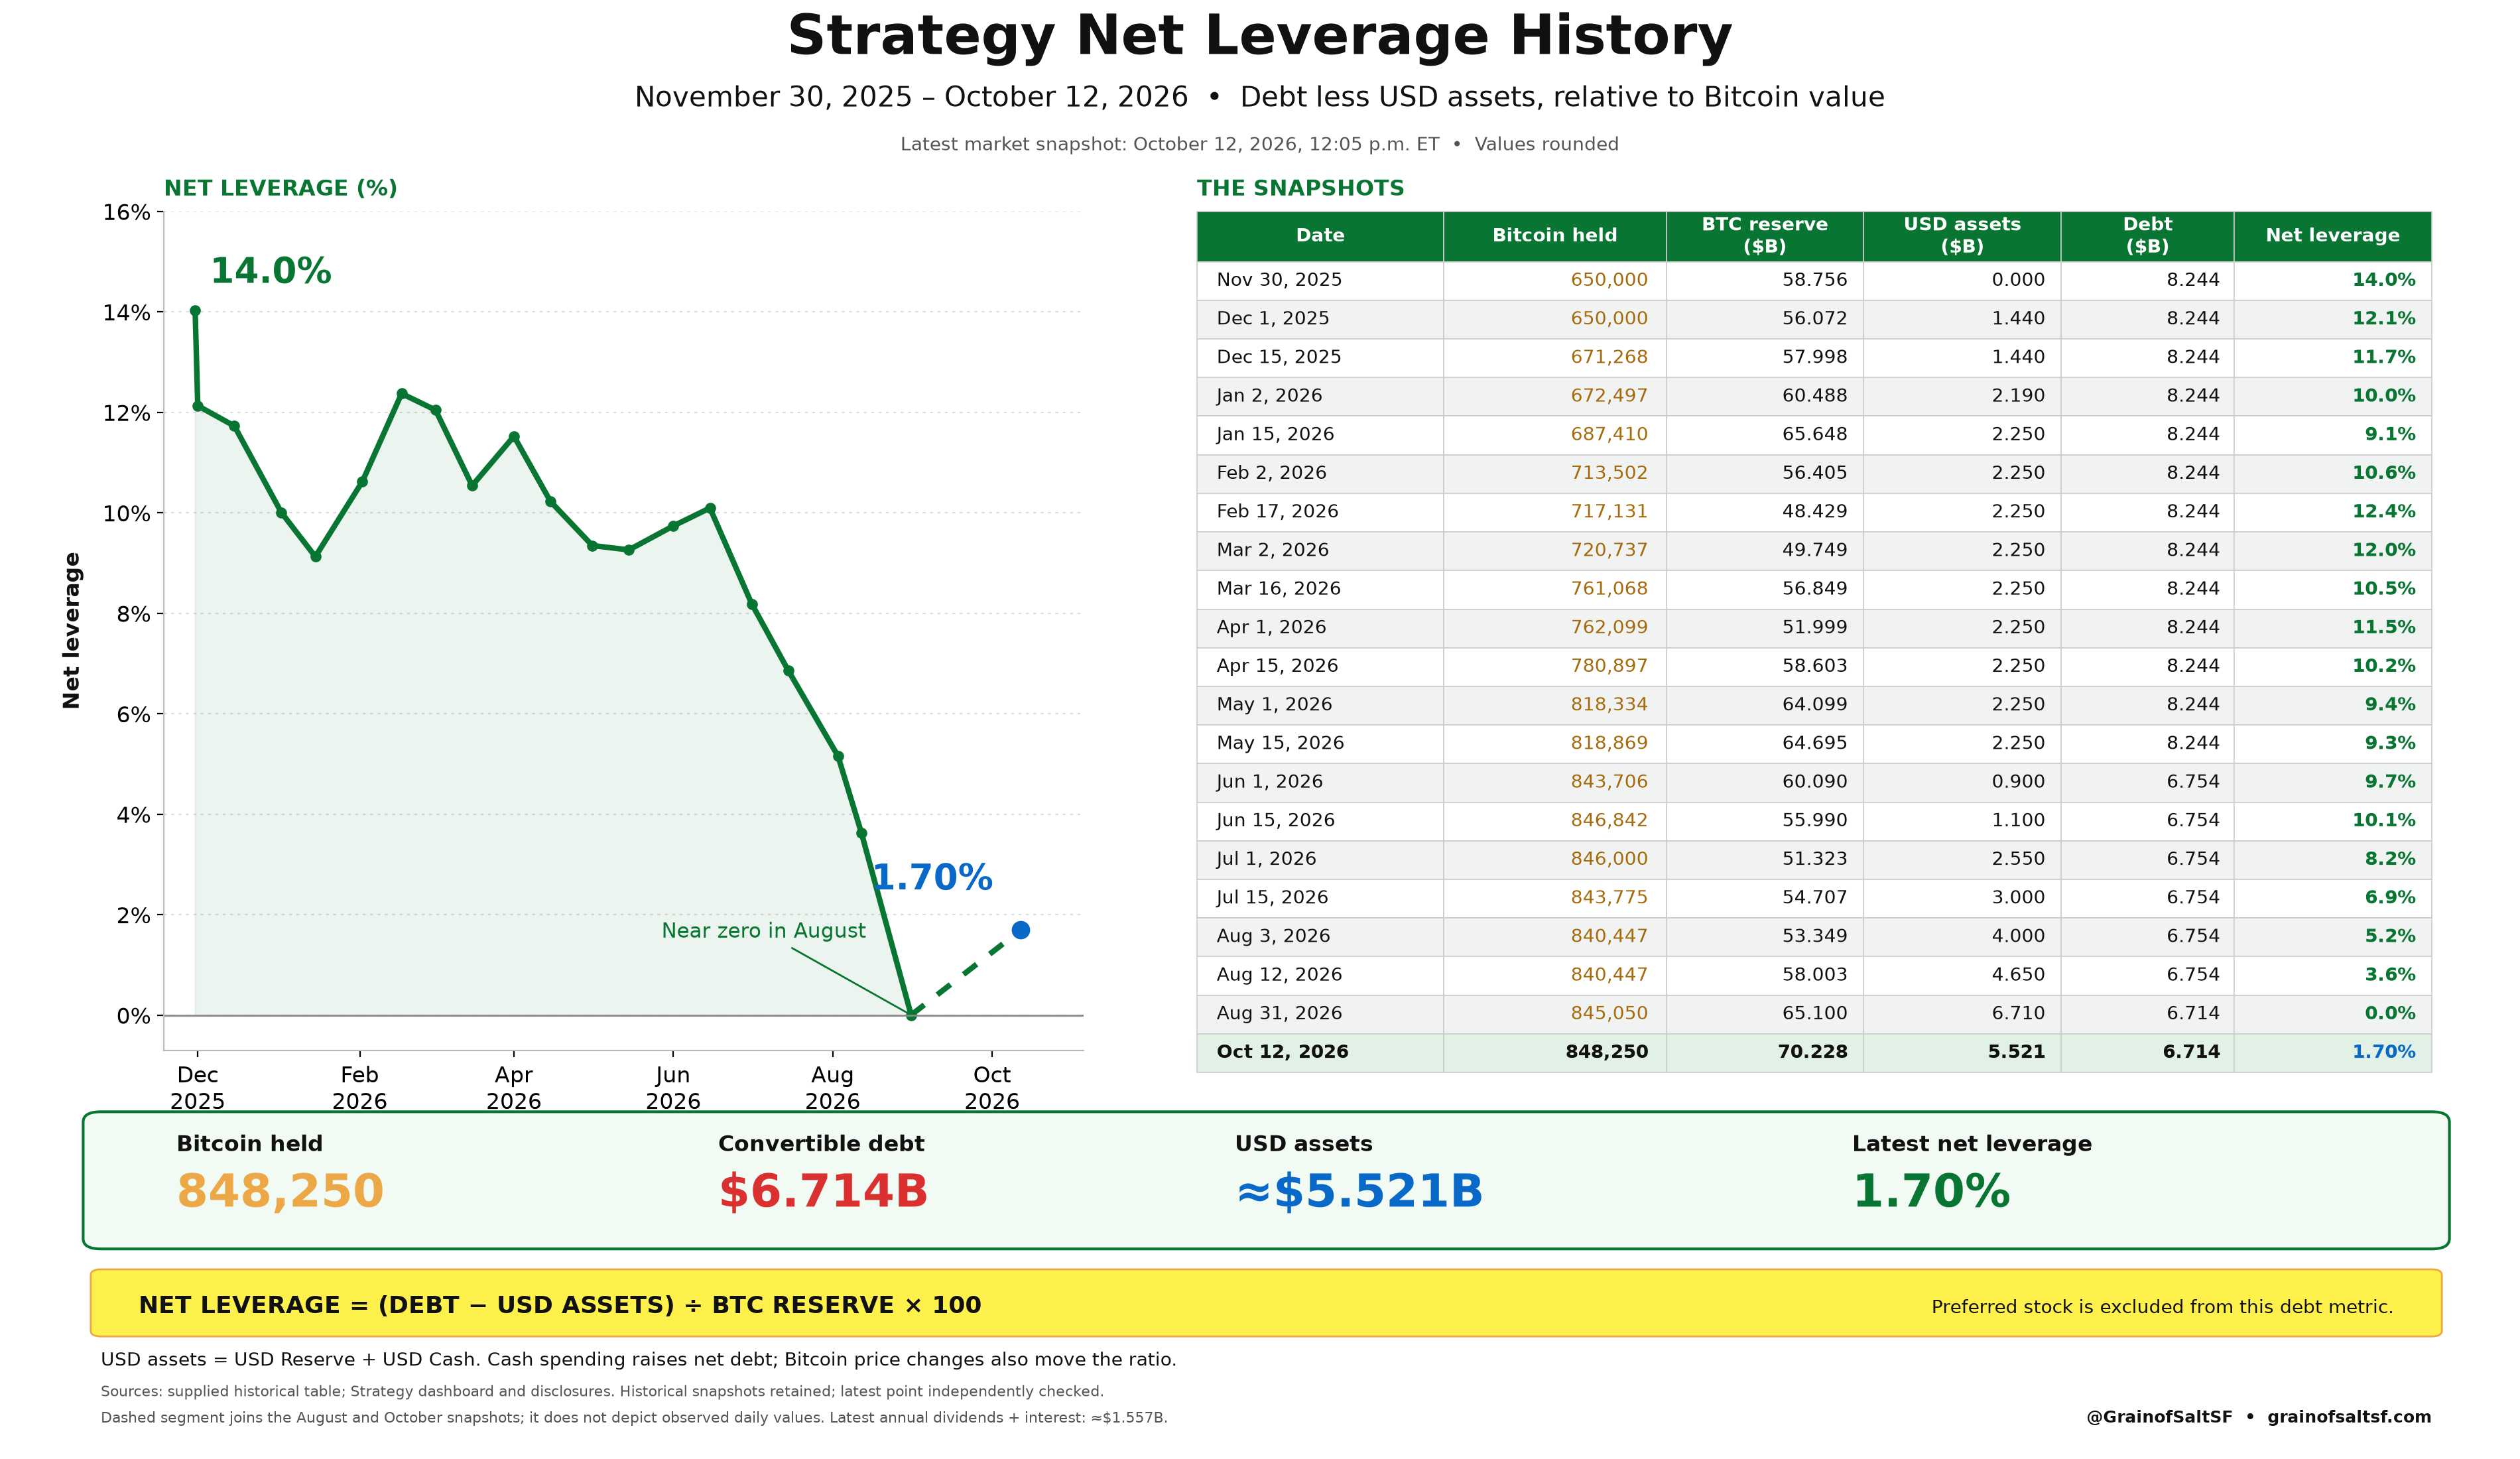
Strategy Net Leverage History — October 12, 2026
18

Convertible Debt at a $100 MSTR Share Price
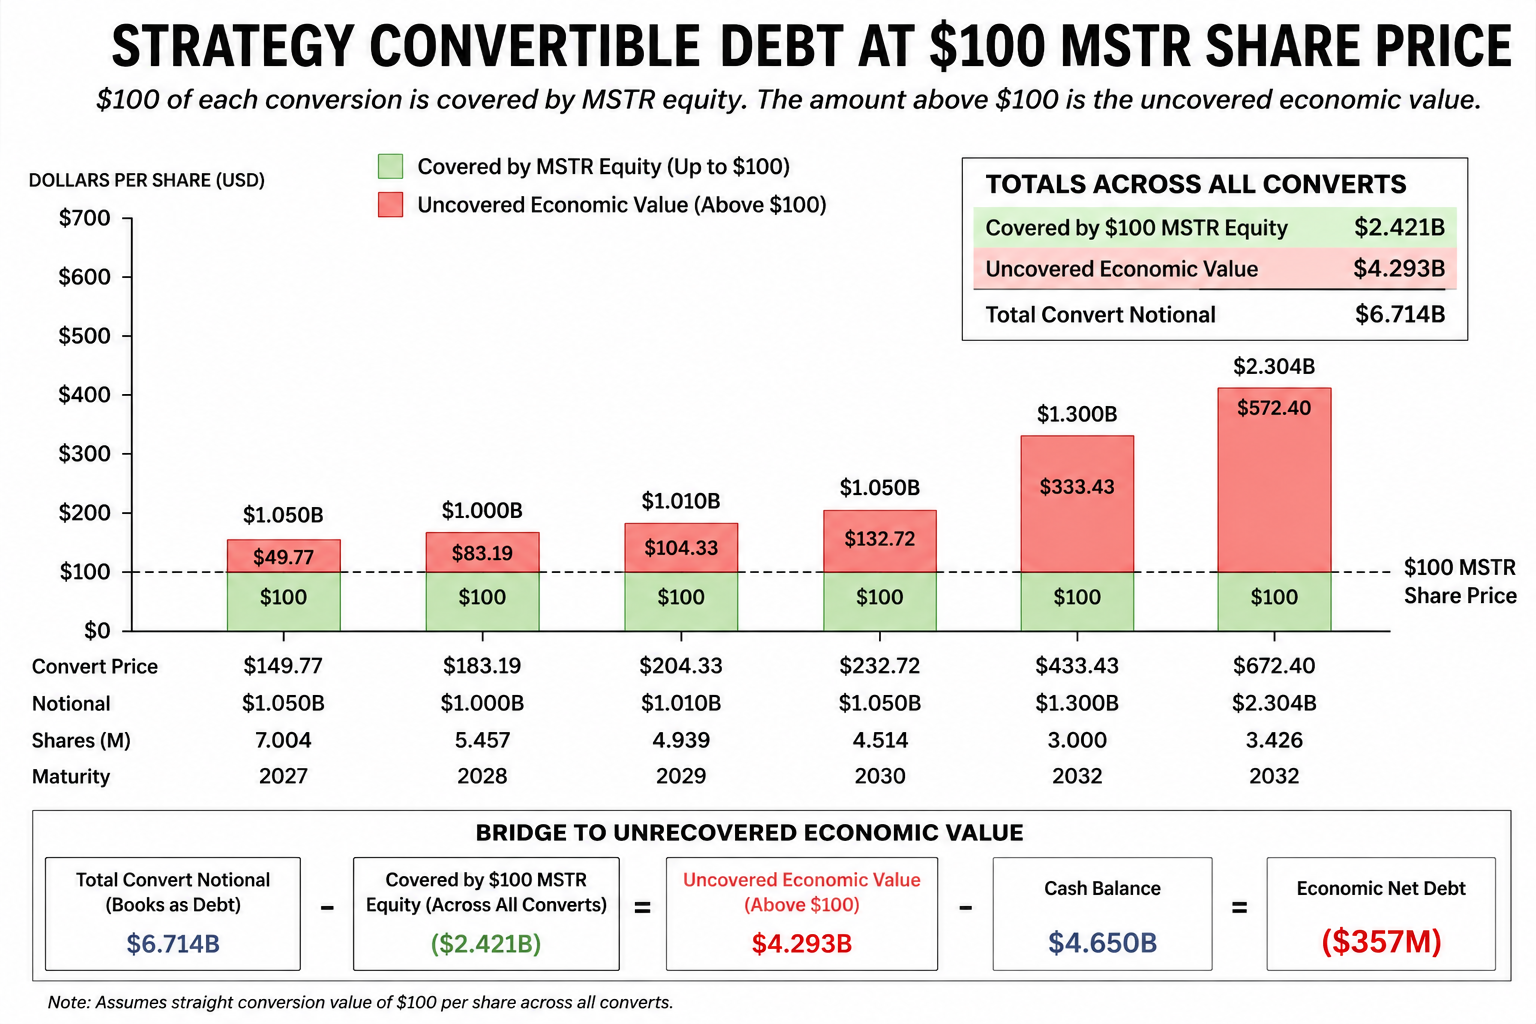
Convertible Debt at a $100 MSTR Share Price
19

Par Is Not One Thing: Bonds and Digital Credit
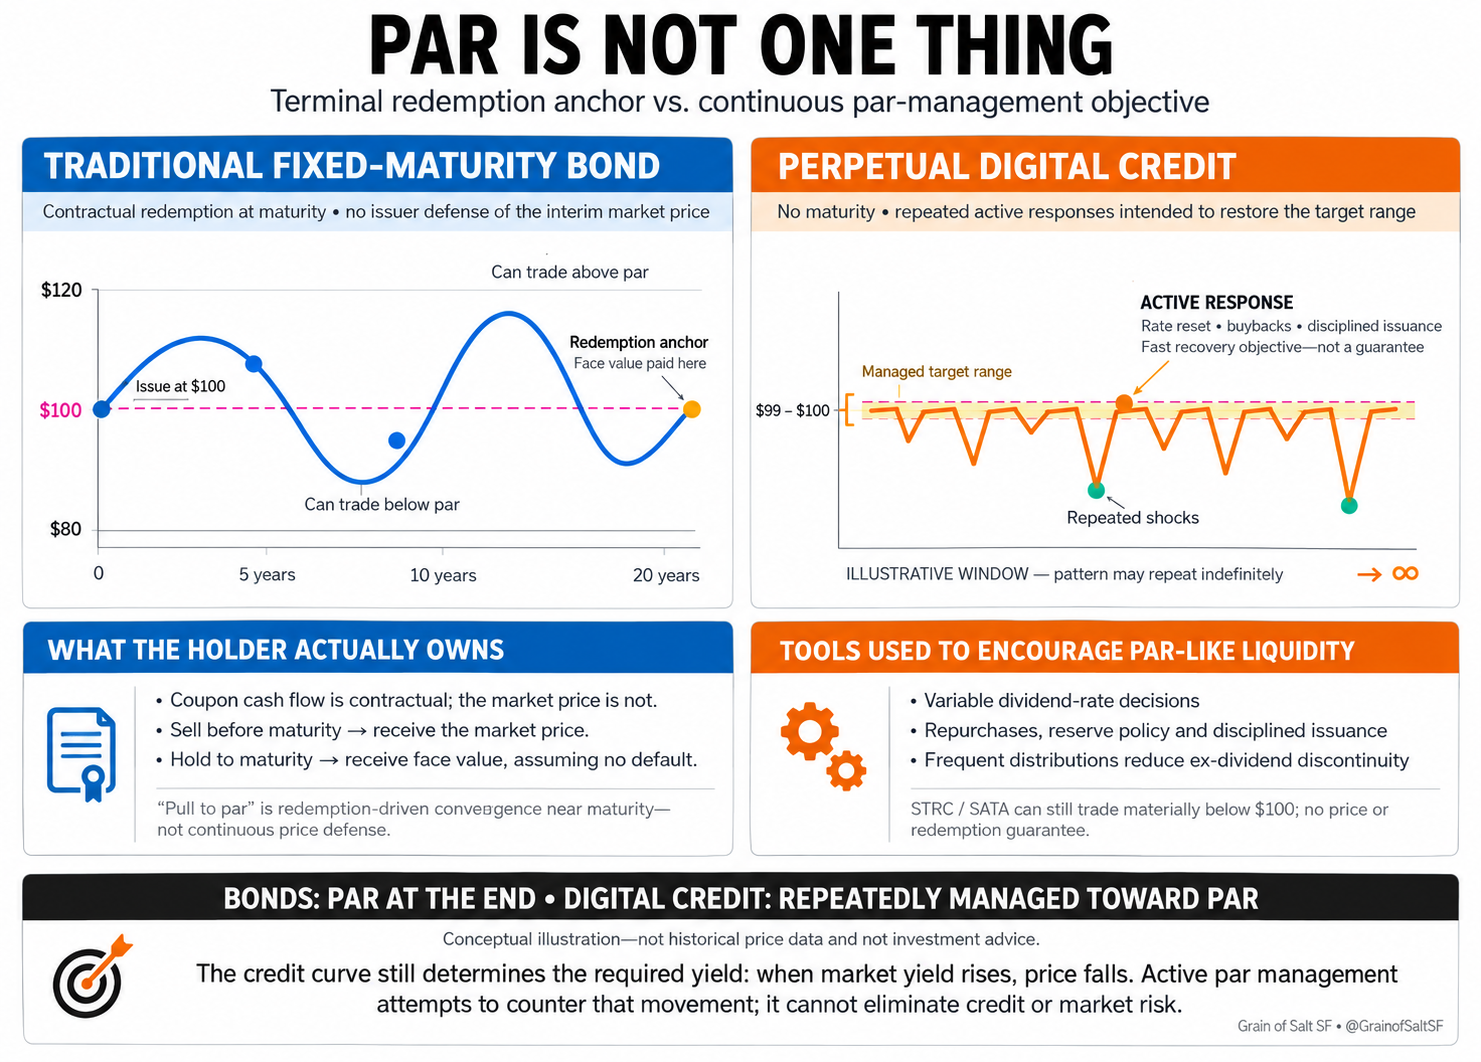
White-background comparison of traditional fixed-maturity bonds with perpetual digital credit: terminal redemption anchor versus continuous par management, holder rights and active response tools; conceptual illustration, not historical price data.
20

The $100 Treasury That Didn’t Stay at $100
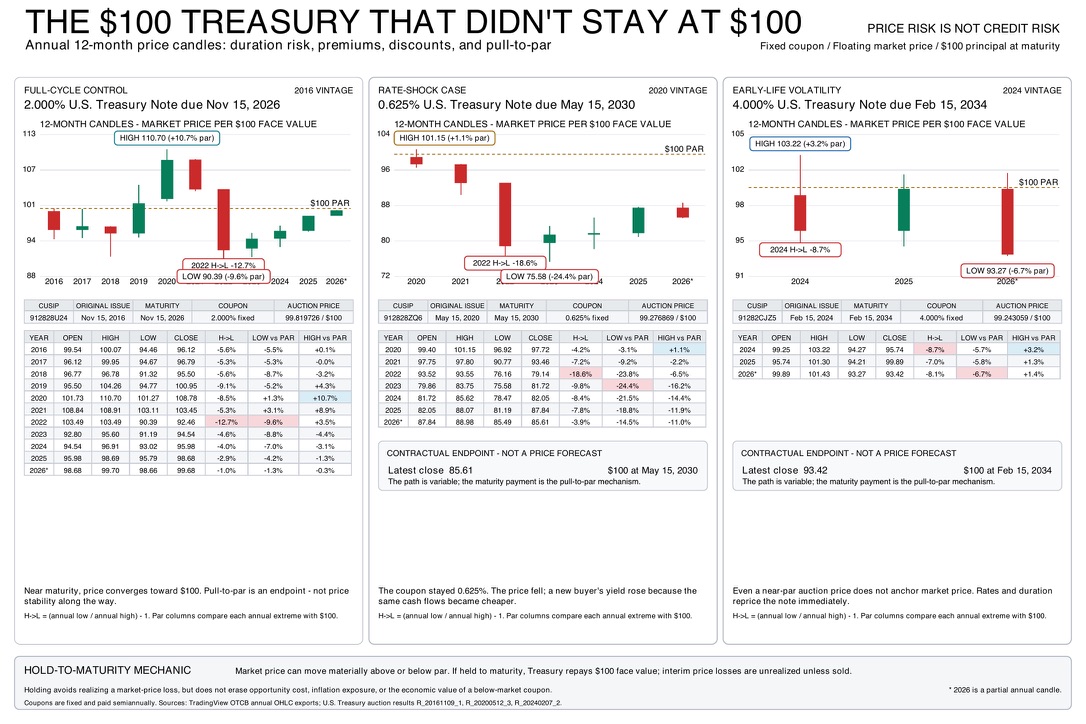
The $100 Treasury That Didn’t Stay at $100: three U.S. Treasury note examples with annual 12-month price candles and tables showing duration risk, premiums, discounts, and pull-to-par; price risk is not credit risk, with $100 principal at maturity.
21

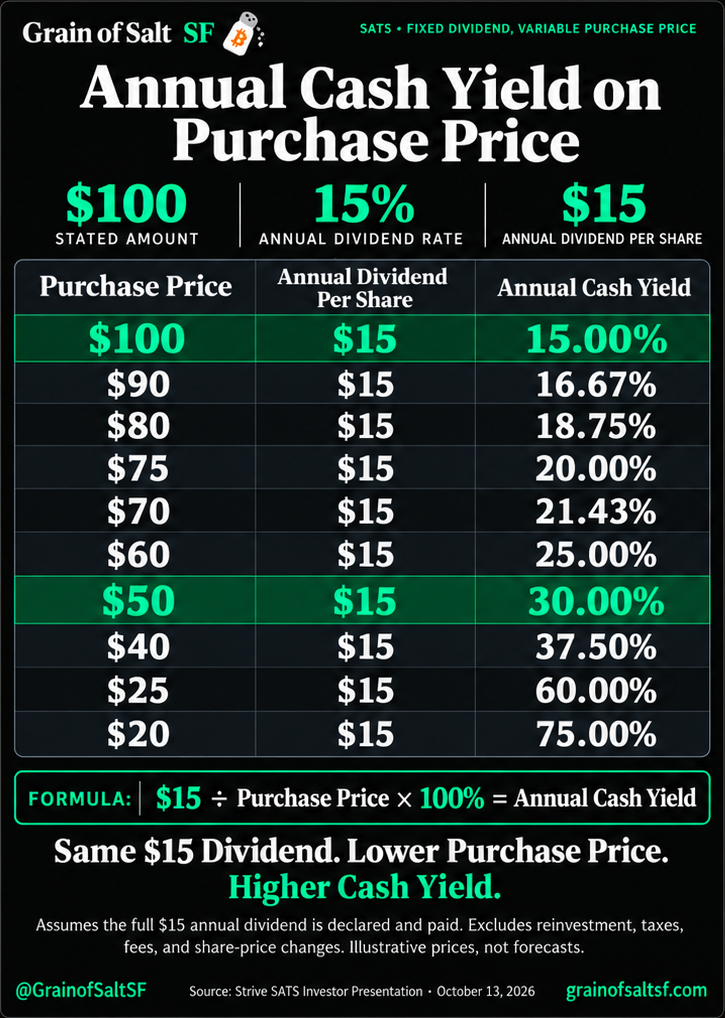
Annual Cash Yield on Purchase Price

SATS Annual Cash Yield on Purchase Price: $100 stated amount and a fixed $15 annual cash dividend model; cash yields from 15.00% at $100 to 75.00% at $20. Assumes the full dividend is declared and paid; not a bond claim. Source: Strive SATS Investor Presentation, October 13, 2026.
22

SATS Price–Yield Curve

October 15, 2026 · Assumes $15 annually declared and paid; not guaranteed
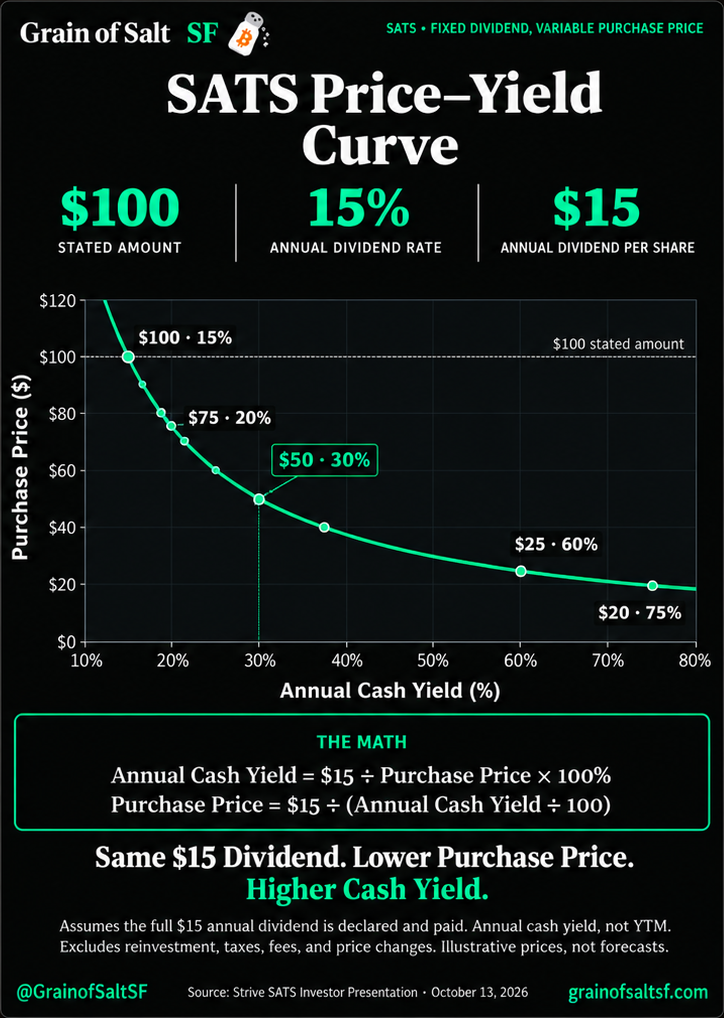
Original SATS Price–Yield Curve: $100 purchase price at 15% annual cash yield, $75 at 20%, $50 at 30%, $25 at 60%, and $20 at 75%, assuming a full $15 annual dividend is declared and paid; illustrative prices, not forecasts or guaranteed dividends. Perpetual preferred-stock education, not a bond yield-to-maturity claim. Source: Strive SATS Investor Presentation, October 13, 2026.

04 Valuation

8 images
23

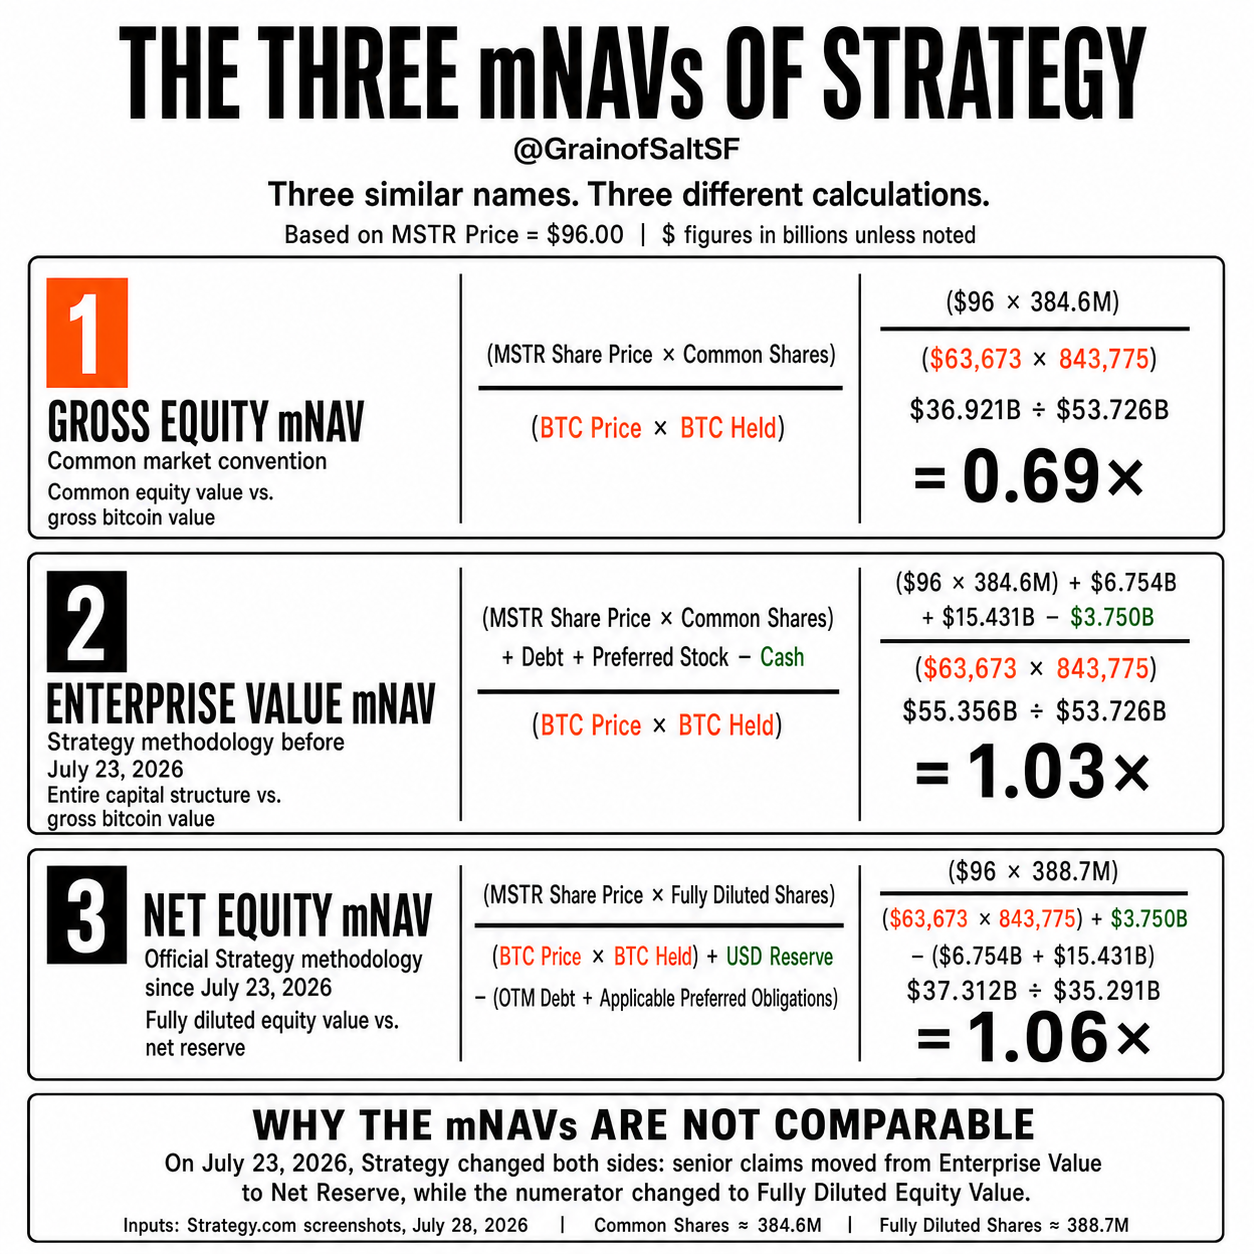
The Three mNAVs of Strategy

v2

The Three mNAVs of Strategy
24

The Three mNAVs — Strategy and Strive

October 15, 2026 · Historical 4:00–4:04 PM ET snapshot; rounded educational calculations
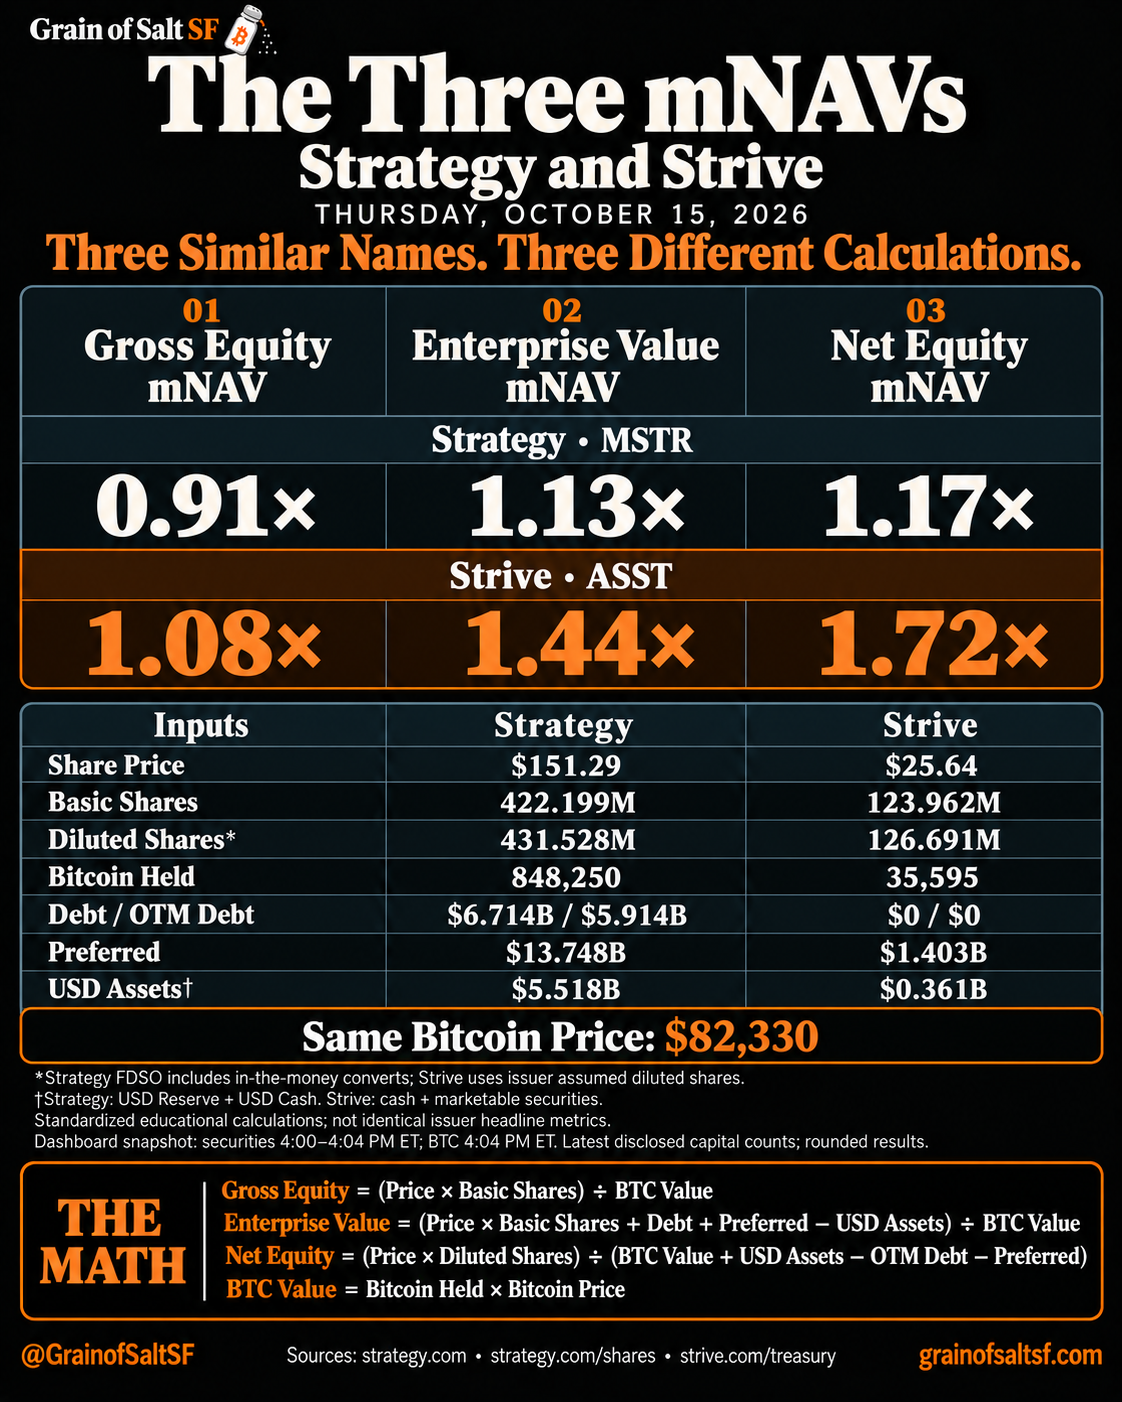
Original black Three mNAVs — Strategy and Strive, October 15, 2026: gross equity, enterprise value and net equity mNAV at the same $82,330 Bitcoin price. Strategy 0.91×, 1.13× and 1.17×; Strive 1.08×, 1.44× and 1.72×. Securities snapshot 4:00–4:04 PM ET and Bitcoin 4:04 PM ET; latest disclosed capital counts, rounded educational calculations. Sources: strategy.com, strategy.com/shares and strive.com/treasury.
25

Strategy New Metrics and MSTR Price Calculations

v2
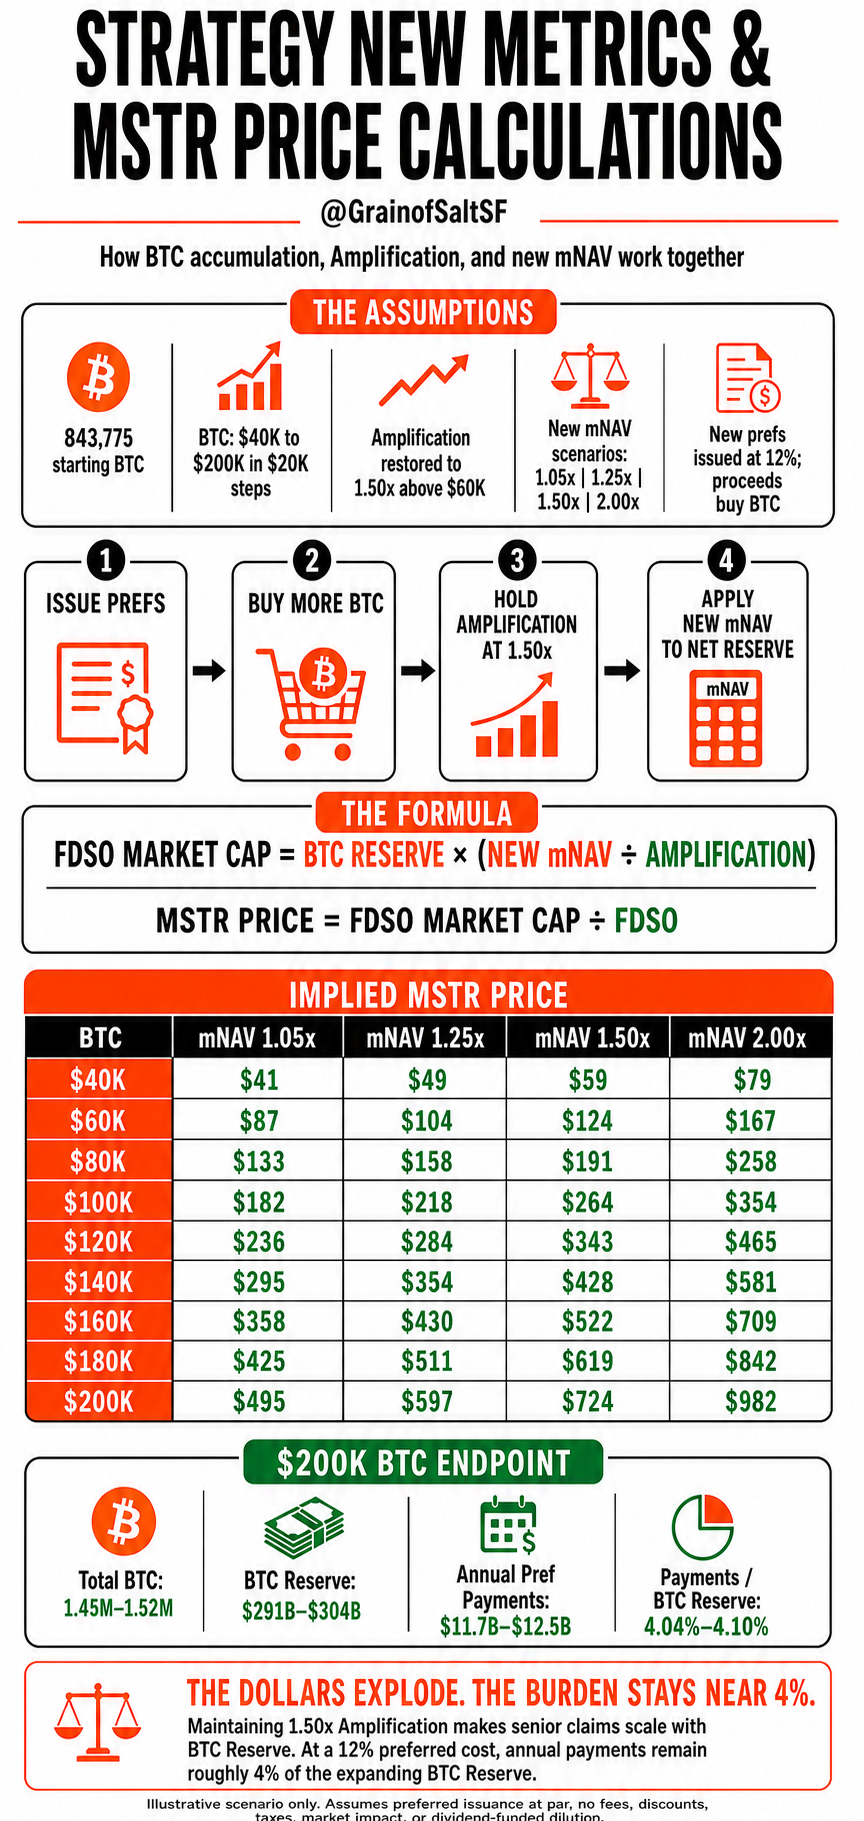
Strategy New Metrics and MSTR Price Calculations
26

Mag 7, Strategy and Strive: Valuation Lenses
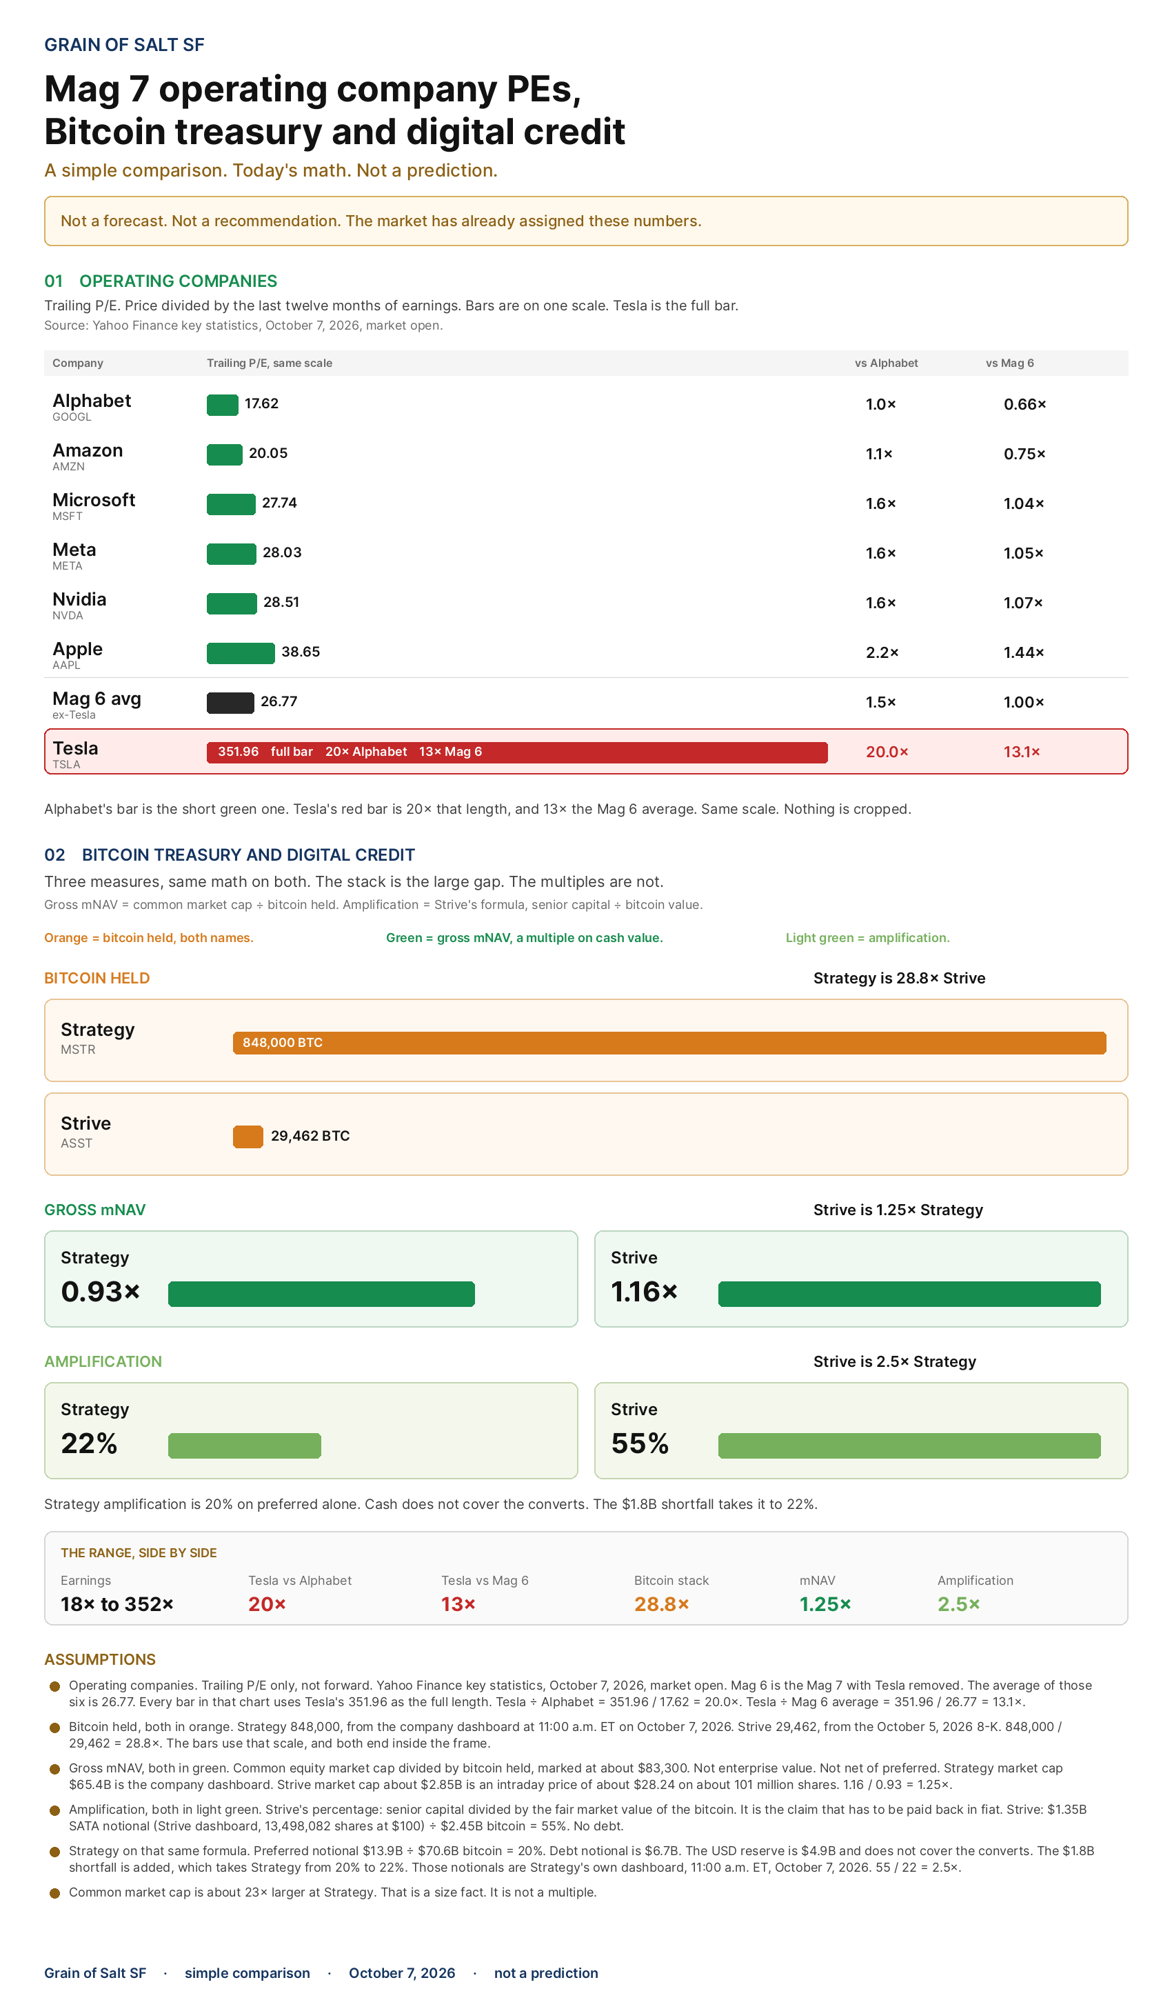
Mag 7, Strategy and Strive: Valuation Lenses
27

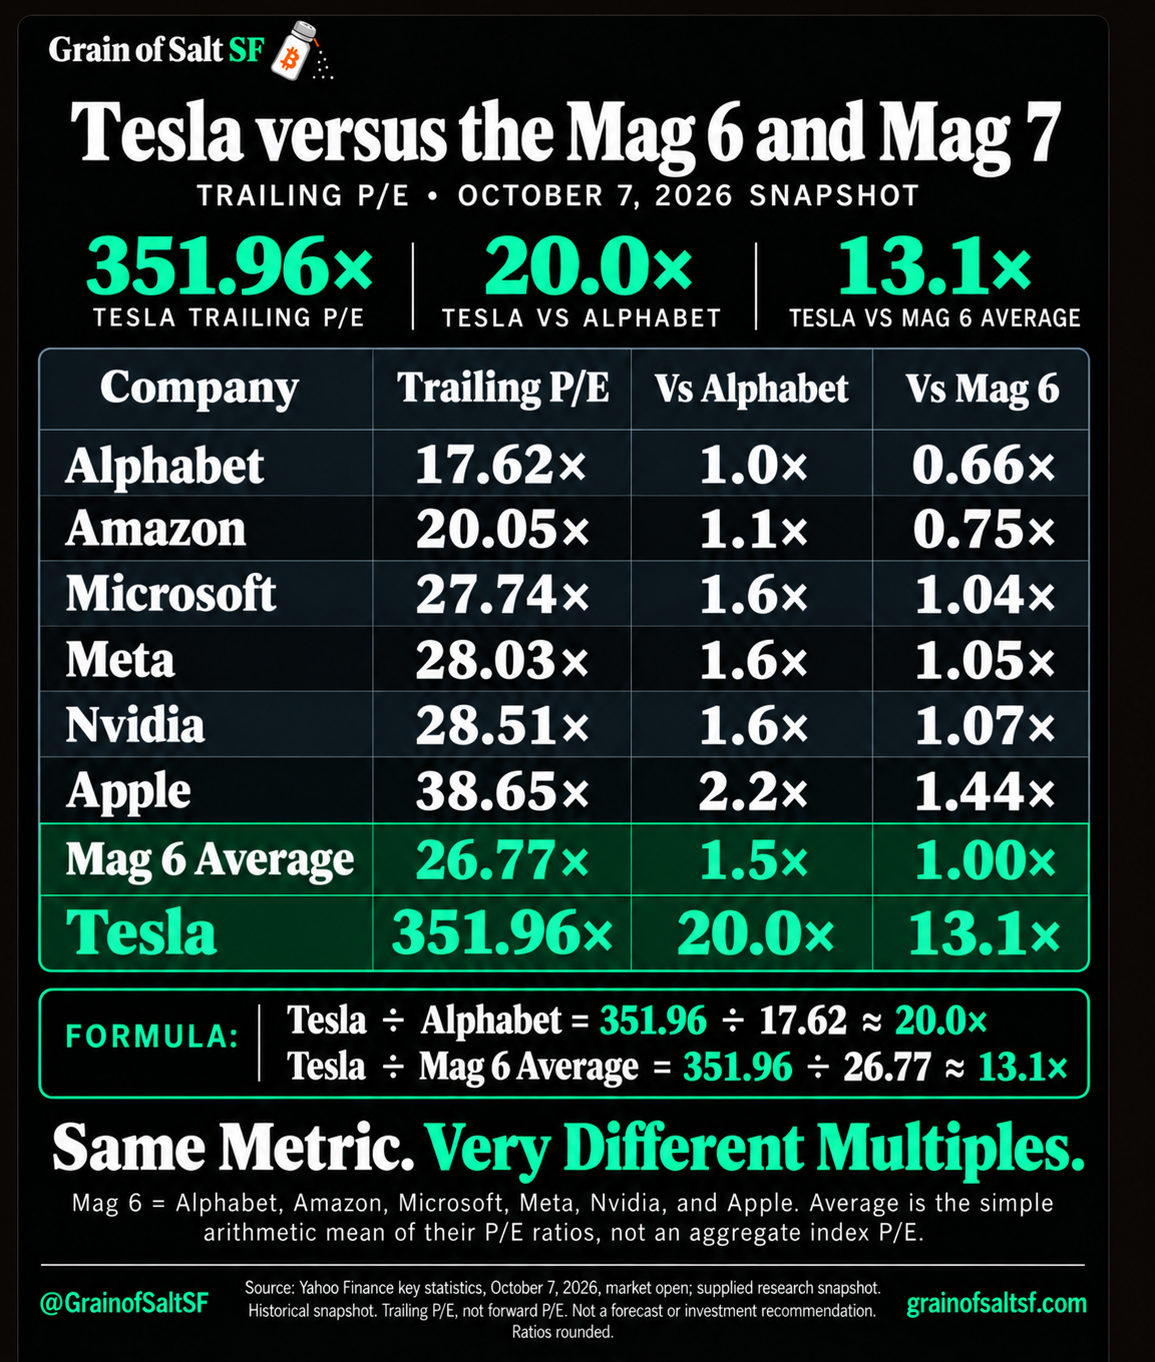
Tesla versus the Mag 6 and Mag 7

Tesla versus the Mag 6 and Mag 7: trailing P/E historical snapshot, October 7, 2026. Tesla 351.96×, 20.0× Alphabet and 13.1× the Mag 6 average; rounded ratios, not a forecast.
28

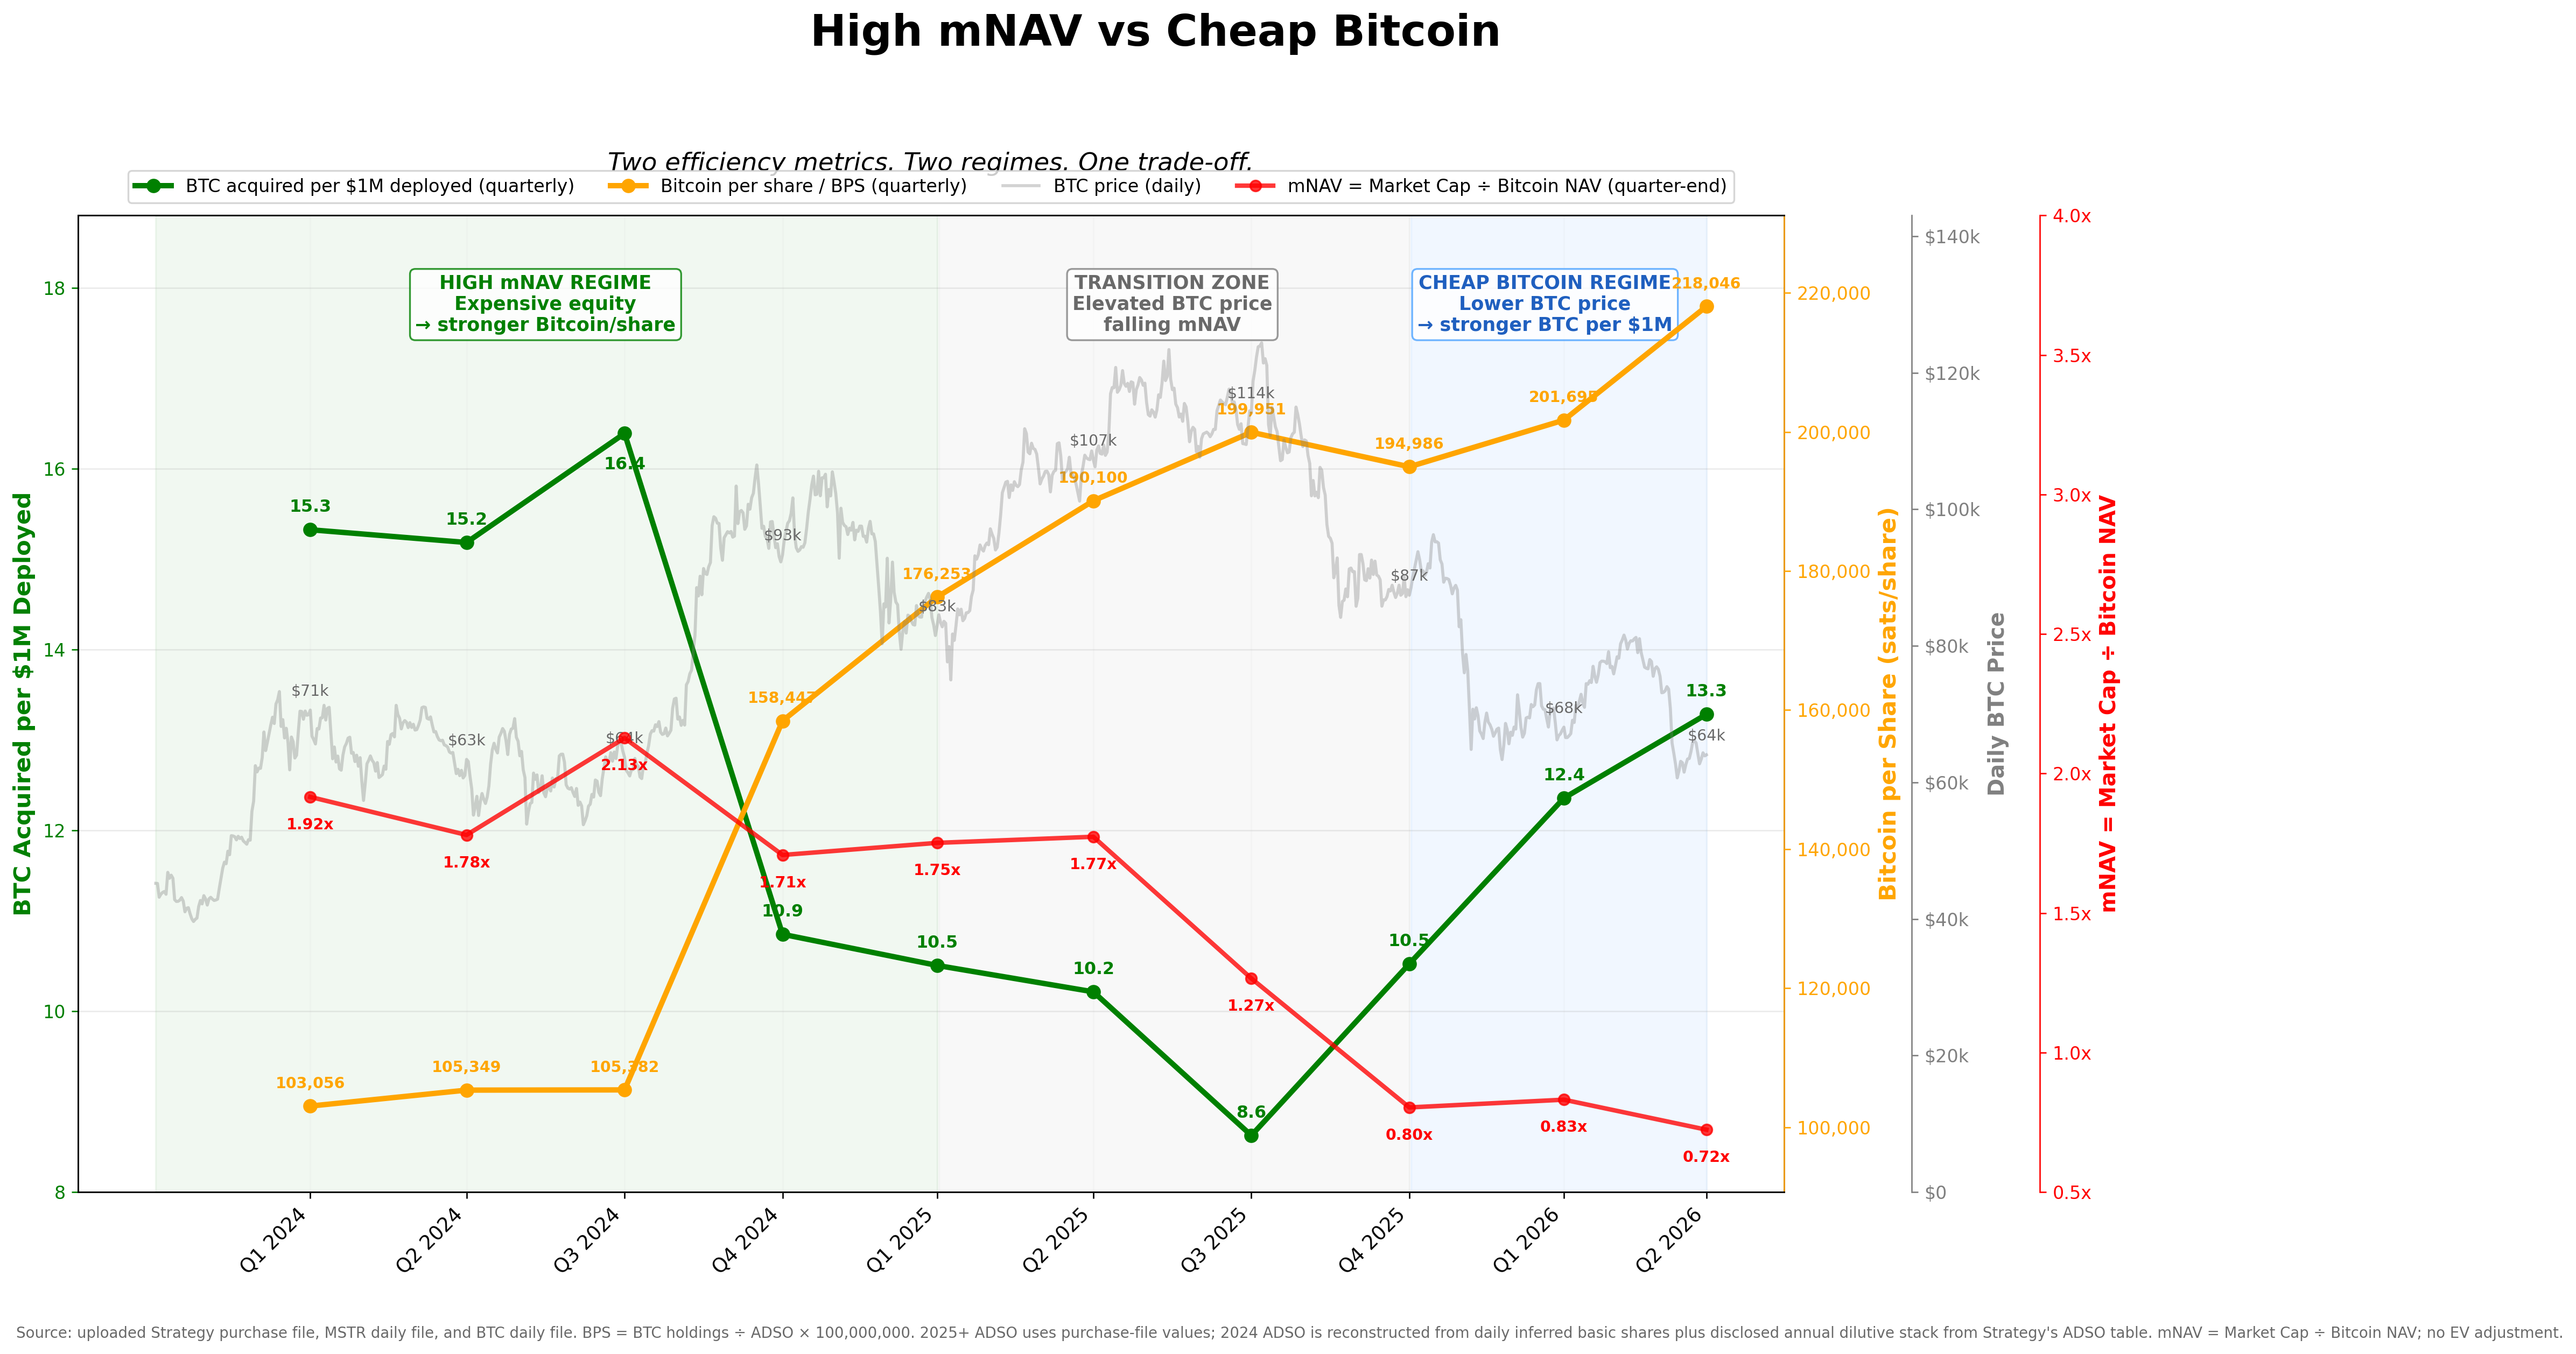
High mNAV versus Cheap Bitcoin

High mNAV versus Cheap Bitcoin
29

Strategy Share Formation and mNAV Share Distribution
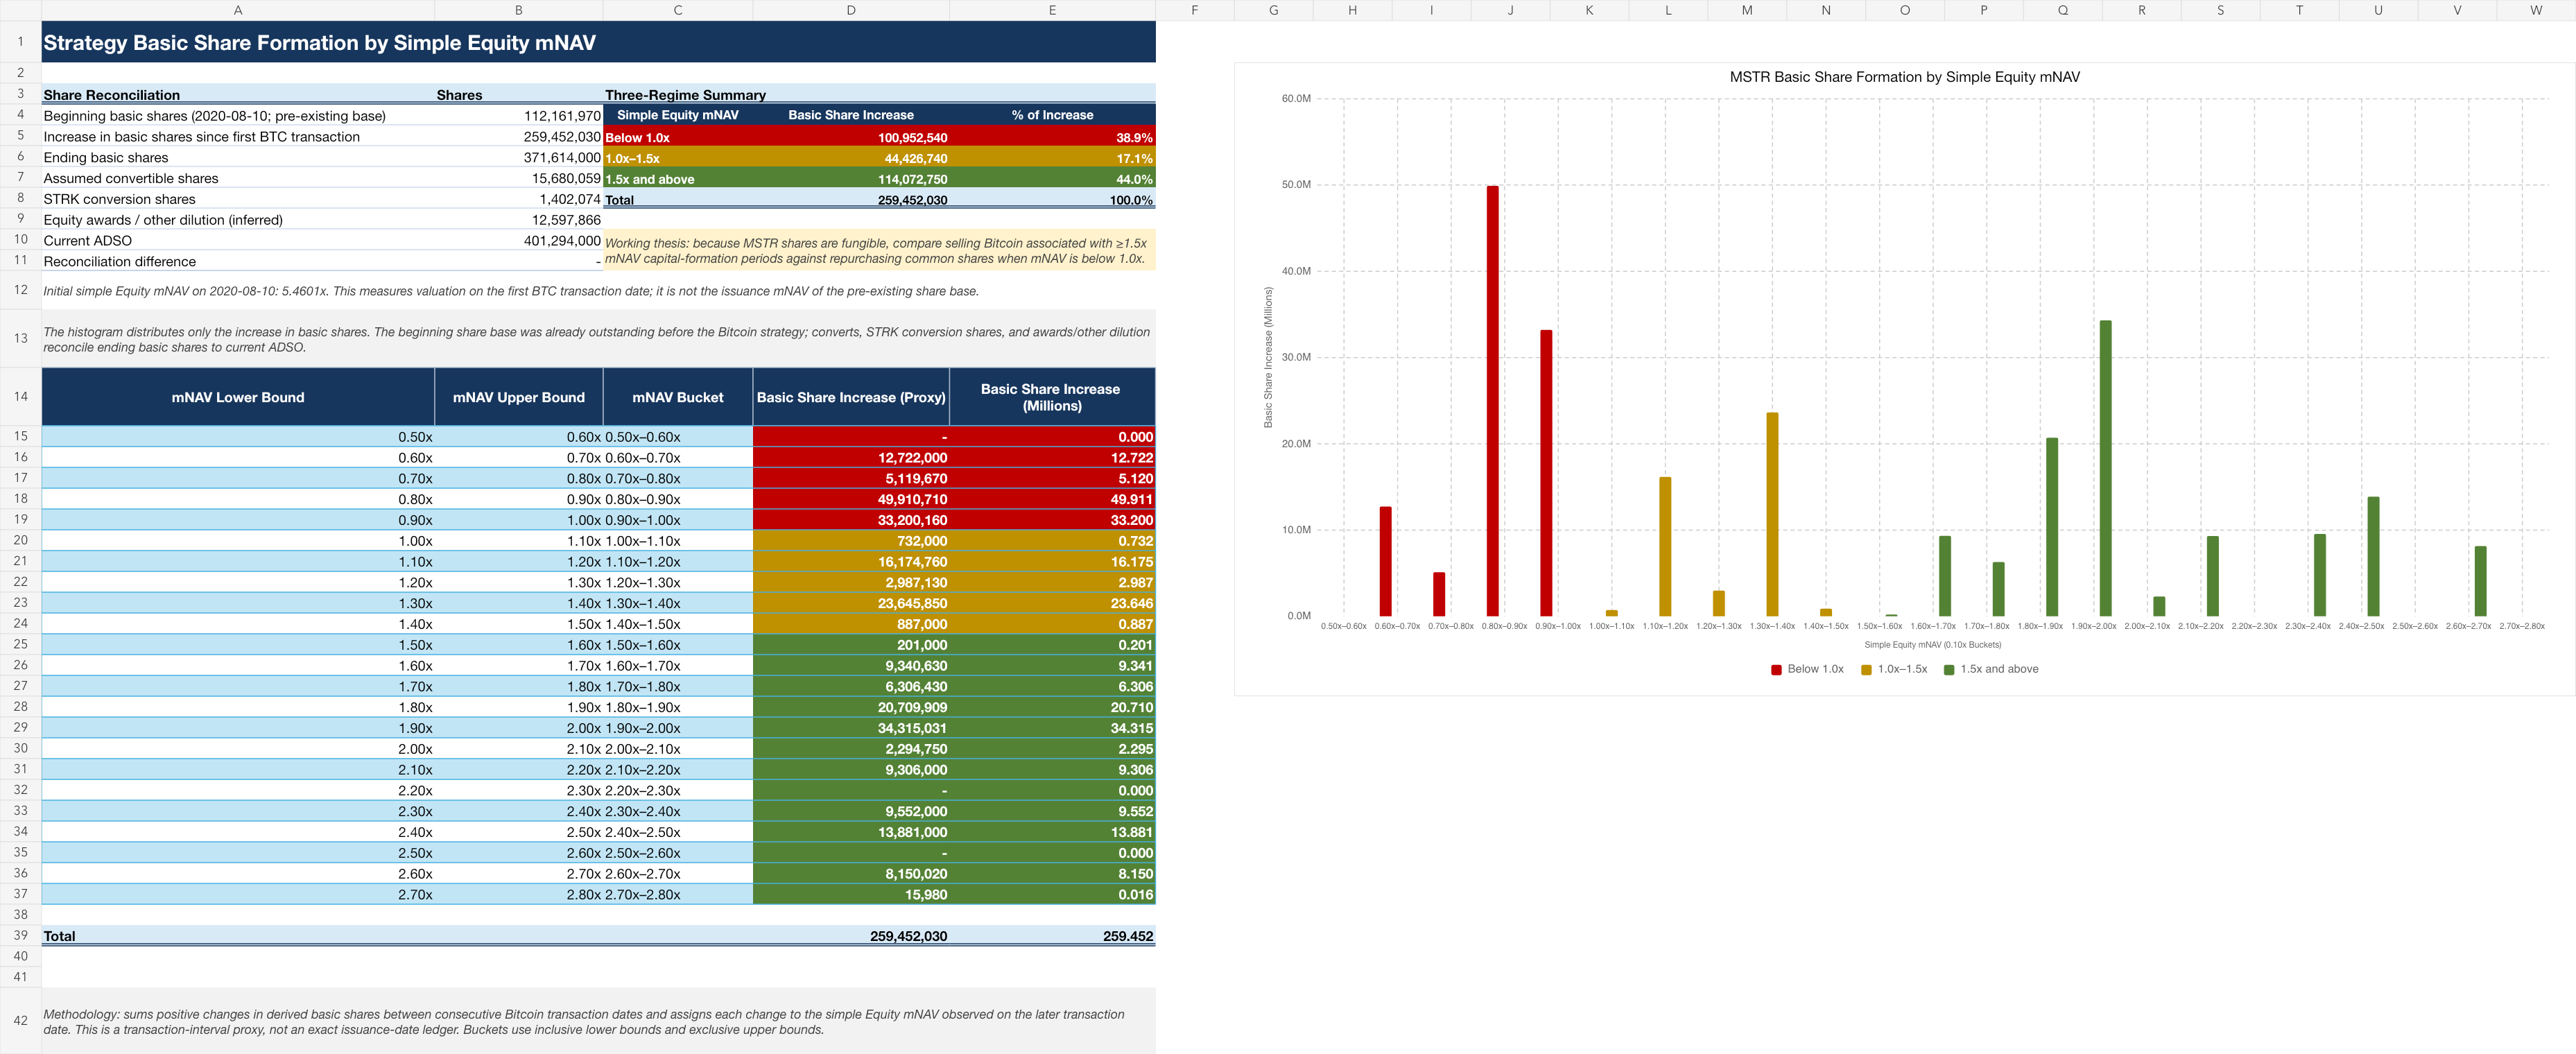
Strategy Share Formation and mNAV Share Distribution
30

Strive Equity mNAV Share Price Scenarios
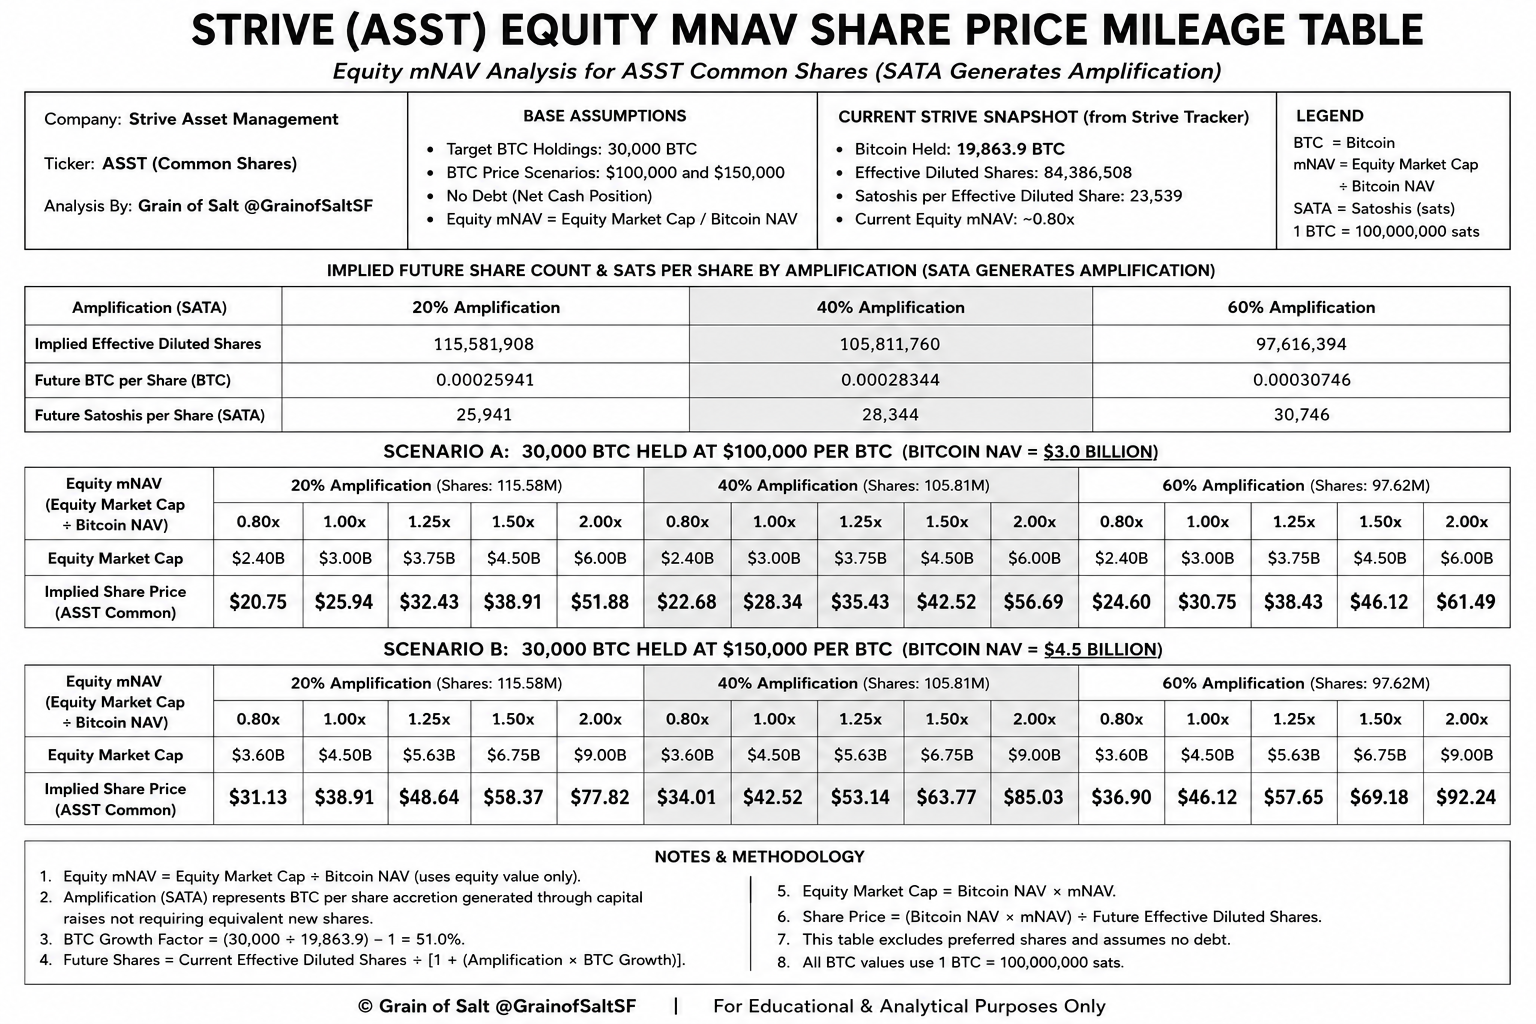
Strive Equity mNAV Share Price Scenarios

The complete collection

30 original images • ZIP • 31.4 MB

Original 30-image collection; newer additions available individually above.

Organized by section, with figure details and collection notes.

Download original 30-image collection